Frontier Airlines 2006 Annual Report Download - page 49
Download and view the complete annual report
Please find page 49 of the 2006 Frontier Airlines annual report below. You can navigate through the pages in the report by either clicking on the pages listed below, or by using the keyword search tool below to find specific information within the annual report.-
 1
1 -
 2
2 -
 3
3 -
 4
4 -
 5
5 -
 6
6 -
 7
7 -
 8
8 -
 9
9 -
 10
10 -
 11
11 -
 12
12 -
 13
13 -
 14
14 -
 15
15 -
 16
16 -
 17
17 -
 18
18 -
 19
19 -
 20
20 -
 21
21 -
 22
22 -
 23
23 -
 24
24 -
 25
25 -
 26
26 -
 27
27 -
 28
28 -
 29
29 -
 30
30 -
 31
31 -
 32
32 -
 33
33 -
 34
34 -
 35
35 -
 36
36 -
 37
37 -
 38
38 -
 39
39 -
 40
40 -
 41
41 -
 42
42 -
 43
43 -
 44
44 -
 45
45 -
 46
46 -
 47
47 -
 48
48 -
 49
49 -
 50
50 -
 51
51 -
 52
52 -
 53
53 -
 54
54 -
 55
55 -
 56
56 -
 57
57 -
 58
58 -
 59
59 -
 60
60 -
 61
61 -
 62
62 -
 63
63 -
 64
64 -
 65
65 -
 66
66 -
 67
67 -
 68
68 -
 69
69 -
 70
70 -
 71
71 -
 72
72 -
 73
73 -
 74
74 -
 75
75 -
 76
76 -
 77
77 -
 78
78 -
 79
79 -
 80
80 -
 81
81 -
 82
82 -
 83
83 -
 84
84 -
 85
85 -
 86
86 -
 87
87 -
 88
88 -
 89
89 -
 90
90 -
 91
91 -
 92
92 -
 93
93 -
 94
94 -
 95
95 -
 96
96 -
 97
97 -
 98
98 -
 99
99 -
 100
100 -
 101
101 -
 102
102 -
 103
103 -
 104
104 -
 105
105 -
 106
106 -
 107
107 -
 108
108 -
 109
109 -
 110
110 -
 111
111 -
 112
112 -
 113
113 -
 114
114 -
 115
115 -
 116
116 -
 117
117 -
 118
118 -
 119
119 -
 120
120 -
 121
121 -
 122
122 -
 123
123 -
 124
124 -
 125
125 -
 126
126 -
 127
127 -
 128
128 -
 129
129 -
 130
130 -
 131
131 -
 132
132 -
 133
133 -
 134
134 -
 135
135 -
 136
136 -
 137
137 -
 138
138 -
 139
139 -
 140
140 -
 141
141 -
 142
142 -
 143
143 -
 144
144 -
 145
145 -
 146
146 -
 147
147 -
 148
148 -
 149
149 -
 150
150 -
 151
151 -
 152
152 -
 153
153 -
 154
154 -
 155
155 -
 156
156 -
 157
157 -
 158
158 -
 159
159 -
 160
160 -
 161
161 -
 162
162 -
 163
163 -
 164
164 -
 165
165 -
 166
166 -
 167
167 -
 168
168 -
 169
169 -
 170
170 -
 171
171 -
 172
172 -
 173
173 -
 174
174 -
 175
175 -
 176
176 -
 177
177 -
 178
178 -
 179
179 -
 180
180 -
 181
181 -
 182
182 -
 183
183 -
 184
184 -
 185
185 -
 186
186 -
 187
187 -
 188
188 -
 189
189 -
 190
190 -
 191
191 -
 192
192 -
 193
193 -
 194
194 -
 195
195 -
 196
196 -
 197
197 -
 198
198 -
 199
199 -
 200
200 -
 201
201 -
 202
202 -
 203
203 -
 204
204 -
 205
205 -
 206
206 -
 207
207 -
 208
208 -
 209
209 -
 210
210 -
 211
211 -
 212
212 -
 213
213 -
 214
214 -
 215
215 -
 216
216 -
 217
217 -
 218
218 -
 219
219 -
 220
220 -
 221
221 -
 222
222 -
 223
223 -
 224
224 -
 225
225 -
 226
226 -
 227
227 -
 228
228 -
 229
229 -
 230
230 -
 231
231 -
 232
232 -
 233
233 -
 234
234 -
 235
235 -
 236
236 -
 237
237 -
 238
238 -
 239
239 -
 240
240 -
 241
241 -
 242
242 -
 243
243 -
 244
244 -
 245
245 -
 246
246 -
 247
247 -
 248
248 -
 249
249 -
 250
250 -
 251
251 -
 252
252 -
 253
253 -
 254
254 -
 255
255 -
 256
256 -
 257
257 -
 258
258 -
 259
259 -
 260
260 -
 261
261 -
 262
262 -
 263
263 -
 264
264 -
 265
265 -
 266
266 -
 267
267 -
 268
268 -
 269
269 -
 270
270 -
 271
271 -
 272
272 -
 273
273 -
 274
274 -
 275
275 -
 276
276 -
 277
277 -
 278
278 -
 279
279 -
 280
280 -
 281
281 -
 282
282 -
 283
283 -
 284
284 -
 285
285 -
 286
286 -
 287
287 -
 288
288 -
 289
289 -
 290
290 -
 291
291 -
 292
292 -
 293
293 -
 294
294 -
 295
295 -
 296
296 -
 297
297 -
 298
298 -
 299
299 -
 300
300 -
 301
301 -
 302
302 -
 303
303 -
 304
304 -
 305
305 -
 306
306 -
 307
307 -
 308
308 -
 309
309 -
 310
310 -
 311
311 -
 312
312 -
 313
313
 |
 |

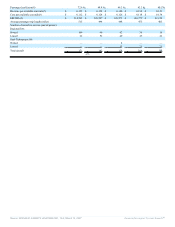
ITEM 6. SELECTED FINANCIAL DATA
The following selected financial data and operating statistics should be read in conjunction with Management's Discussion and
Analysis Of Financial Condition and Results of Operations, and the consolidated financial statements and related notes included in
Item 8 of the Form 10-K.
Years Ended December 31,
2006 2005 2004 2003 2002
(in thousands, except share, per share and airline operating data)
Statement of Operations Data:
Operating revenues:
Passenger $ 1,118,226 $ 883,906 $ 637,389 $ 480,025 S353,208
Charter and ground handling 8,932 11,611 8,682 5,899 2,451
Other 15,920 9,504 253 6,356 538
Total operating revenues 1,143,078 905,021 646,324 492,280 356,197
Operating expenses:
Wages and benefits 175,483 143,826 112,305 86,949 63,572
Aircraft fuel(11) 325,500 278,923 174,208 106,840 64,869
Passenger fees and commissions — — 2,939 6,254 7,925
Landing fees 41,993 30,376 24,201 19,098 13,053
Aircraft and engine rent 94,773 77,725 74,514 67,350 64,991
Maintenance and repair 105,198 76,481 70,290 53,475 43,441
Insurance and taxes 17,652 16,117 13,186 12,859 17,103
Depreciation and amortization 92,228 64,877 34,412 23,873 12,032
Impairment loss and accrued aircraft return costs
(credits)(1) (2,050) (4,218) 1,441 2,756 7,196
Other 79,708 62,195 47,483 30,115 32,444
Total operating expenses 930,485 746,302 554,979 409,569 326,626
Operating income 212,593 158,719 91,345 82,711 29,571
Other income (expense):
Interest expense (91,128) (63,546) (28,464) (22,789) (12,868)
Interest and other income 9,944 5,002 518 195 526
Total other income (expense) (81,184) (58,544) (27,946) (22,594) (12,342)
Income before income taxes 131,409 100,175 63,399 60,117 17,229
Income tax expense 51,899 39,521 24,547 23,979 9,540
Net income 79,510 60,654 38,852 36,138 7,689
Preferred stock dividends(2) — — — (170) (413)
Net income available for common stockholders $ 79,510 $ 60,654 $ 38,852 $ 35,968 $ 7,276
Net income available for common stockholders
per share:
Basic $ 1.89 $ 1.69 $ 1.66 $ 1.80 $ 0.36
Diluted $ 1.82 $ 1.66 $ 1.62 $ 1.73 $ 0.35
Weighted average common shares outstanding(3):
Basic 42,149,668 35,854,249 23,349,613 20,000,000 20,000,000
Diluted 43,615,946 36,548,340 23,906,762 20,841,415 20,832,750
Other Financial Data:
Net cash from:
Operating activities $ 229,147 $ 170,879 $ 116,827 $ 91,627 $ 42,710
Investing activities $ (114,510) $ (175,152) $ (102,424) $ (30,683)$ (34,552)
Financing activities $ (81,114) $ 120,058 $ 9,282 $ (45,093)$ (4,747)
Airline Operating Data:
Passengers carried 12,666,130 9,137,132 6,842,407 5,120,987 3,758,748
Revenue passenger miles(4) 6,650,398,521 4,516,518,136 3,062,940,174 2,319,261,441 1,523,201,642
Available seat miles(5) 9,154,719,233 6,559,966,278 4,618,042,586 3,665,876,102 2,535,087,476
Source: REPUBLIC AIRWAYS HOLDINGS INC, 10-K, March 15, 2007 Powered by Morningstar® Document Research℠
