EasyJet 2010 Annual Report Download - page 97
Download and view the complete annual report
Please find page 97 of the 2010 EasyJet annual report below. You can navigate through the pages in the report by either clicking on the pages listed below, or by using the keyword search tool below to find specific information within the annual report.-
 1
1 -
2
-
3
-
4
-
5
-
6
-
7
-
8
-
9
-
10
-
11
-
12
-
13
-
14
-
15
-
16
-
17
-
18
-
19
-
20
-
21
-
22
-
23
-
24
-
25
-
26
-
27
-
28
-
29
-
30
-
31
-
32
-
33
-
34
-
35
-
36
-
37
-
38
-
39
-
40
-
41
-
42
-
43
-
44
-
45
-
46
-
47
-
48
-
49
-
50
-
51
-
52
-
53
-
54
-
55
-
56
-
57
-
58
-
59
-
60
-
61
-
62
-
63
-
64
-
65
-
66
-
67
-
68
-
69
-
70
-
71
-
72
-
73
-
74
-
75
-
76
-
77
-
78
-
79
-
80
-
81
-
82
-
83
-
84
-
85
-
86
-
 87
87 -
 88
88 -
 89
89 -
 90
90 -
 91
91 -
 92
92 -
 93
93 -
 94
94 -
 95
95 -
 96
96 -
 97
97 -
 98
98 -
 99
99 -
 100
100
 |
 |

Overview Business review Governance Accounts Other information
easyJet plc
Annual report and accounts 2010
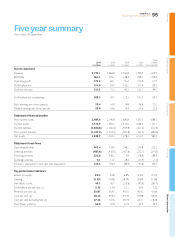
Five year summary
Year end to 30 September
95
2010
£ million
2009
£ million
2008
£ million
2007
£ million
2006
£ million
(re-presented)
Income statement
Revenue 2,973.1 2,666.8 2,362.8 1,797.2 1,619.7
EBITDAR 361.3 225.1 248.6 298.2 278.5
Operating profit 173.6 60.1 91.0 172.0 117.7
Profit before tax 154.0 54.7 110.2 201.9 129.2
Profit for the year 121.3 71.2 83.2 152.3 94.1
Profit before tax (underlying) 188.3 43.7 123.1 191.3 129.2
Basic earnings per share (pence) 28.4 16.9 19.8 36.6 23.2
Diluted earnings per share (pence) 28.0 16.6 19.4 35.6 22.6
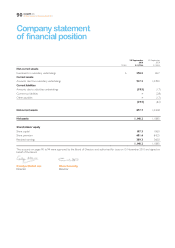
Statement of financial position
Non-current assets 2,487.6 2,190.8 1,680.8 1,350.0 1,088.3
Current assets 1,514.9 1,482.2 1,415.0 1,166.4 1,101.1
Current liabilities (1,064.6) (1,062.2) (909.8) (621.3) (522.9)
Non-current liabilities (1,437.2) (1,303.5) (907.8) (742.7) (683.6)
Net assets 1,500.7 1,307.3 1,278.2 1,152.4 982.9
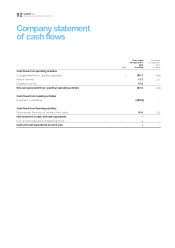
Statement of cash flows
Operating activities 363.4 134.5 296.2 270.8 225.2
Investing activities (482.0) (430.0) (417.6) (272.1) (314.3)
Financing activities 232.8 440.2 5.9 (128.9) 284.5
Exchange activities 9.1 11.7 28.6 (11.4) (1.7)
Increase / (decrease) in cash and cash equivalents 123.3 156.4 (86.9) (141.6) 193.7
Key performance indicators
Return on equity 8.6% 5.5% 6.8% 14.3% 10.1%
Gearing 31.8% 37.6% 28.7% 20.4% 31.0%
Net debt / (cash) 40.1 45.7 (235.6) (393.4) (381.0)
Profit before tax per seat (£) 2.75 1.04 2.12 4.54 3.32
Revenue per seat (£) 53.07 50.47 45.51 40.42 41.66
Cost per seat (£) 50.32 49.43 43.39 35.88 38.34
Cost per seat excluding fuel (£) 37.23 34.16 29.74 26.31 28.36
Seats flown (millions) 56.0 52.8 51.9 44.5 38.9