EasyJet 2010 Annual Report Download - page 83
Download and view the complete annual report
Please find page 83 of the 2010 EasyJet annual report below. You can navigate through the pages in the report by either clicking on the pages listed below, or by using the keyword search tool below to find specific information within the annual report.-
 1
1 -
2
-
3
-
4
-
5
-
6
-
7
-
8
-
9
-
10
-
11
-
12
-
13
-
14
-
15
-
16
-
17
-
18
-
19
-
20
-
21
-
22
-
23
-
24
-
25
-
26
-
27
-
28
-
29
-
30
-
31
-
32
-
33
-
34
-
35
-
36
-
37
-
38
-
39
-
40
-
41
-
42
-
43
-
44
-
45
-
46
-
47
-
48
-
49
-
50
-
51
-
52
-
53
-
54
-
55
-
56
-
57
-
58
-
59
-
60
-
61
-
62
-
63
-
64
-
65
-
66
-
67
-
68
-
69
-
70
-
71
-
72
-
 73
73 -
 74
74 -
 75
75 -
 76
76 -
 77
77 -
 78
78 -
 79
79 -
 80
80 -
 81
81 -
 82
82 -
 83
83 -
 84
84 -
 85
85 -
 86
86 -
 87
87 -
 88
88 -
 89
89 -
 90
90 -
 91
91 -
 92
92 -
 93
93 -
94
-
95
-
96
-
97
-
98
-
99
-
100
 |
 |

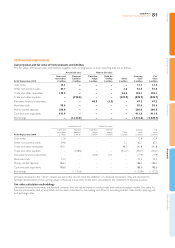
Overview Business review Governance Accounts Other information
easyJet plc
Annual report and accounts 2010
81
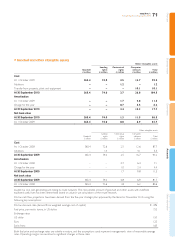
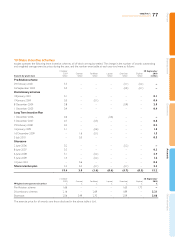
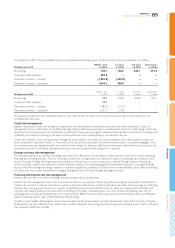
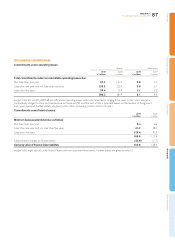
22 Financial instruments
Carrying value and fair value of financial assets and liabilities
The fair values of financial assets and liabilities, together with carrying values, at each reporting date are as follows:
Amortised cost Held at fair value
At 30 September 2010
Loans and
receivables
£ million
Financial
liabilities
£ million
Cash flow
hedge
£ million
Held for
trading
£ million
Other
£ million
Carrying
value
£ million
Fair
value
£ million
Loan notes 13.1 – – – – 13.1 13.4
Other non-current assets 49.7 – – – 3.8 53.5 53.5
Trade and other receivables 129.9 – – – 64.2 194.1 194.1
Trade and other payables – (398.8) – – (429.9) (828.7) (828.7)
Derivative financial instruments – – 48.5 (1.3) – 47.2 47.2
Restricted cash 55.6 – – – – 55.6 55.6
Money market deposits 260.0 – – – – 260.0 260.0
Cash and cash equivalents 911.9 – – – – 911.9 911.9
Borrowings – (1,212.0) – – – (1,212.0) (1,220.9)
Amortised cost Held at fair value
At 30 September 2009
Loans and
receivables
£ million
Financial
liabilities
£ million
Cash flow
hedge
£ million
Held for
trading
£ million
Other
£ million
Carrying
value
£ million
Fair
value
£ million
Loan notes 12.6 – – – – 12.6 12.9
Other non-current assets 59.6 – – – 3.1 62.7 62.7
Trade and other receivables 193.1 – – – 48.7 241.8 241.8
Trade and other payables – (338.6) – – (412.1) (750.7) (750.7)
Derivative financial instruments – – (30.6) 12.7 – (17.9) (17.9)
Restricted cash 72.3 – – – – 72.3 72.3
Money market deposits 286.3 – – – – 286.3 286.3
Cash and cash equivalents 788.6 – – – – 788.6 788.6
Borrowings – (1,120.6) – – – (1,120.6) (1,132.3)
Amounts disclosed in the “other” column are items that do not meet the definition of a financial instrument. They are disclosed to
facilitate reconciliation of the carrying values of financial instruments to line items presented in the statement of financial position.
Fair value calculation methodology
Derivative financial instruments are forward contracts and are valued based on market rates and market-accepted models. Fair value for
financial instruments held at amortised cost has been estimated by discounting cash flows at prevailing interest rates and by applying year
end exchange rates.