EasyJet 2010 Annual Report Download - page 69
Download and view the complete annual report
Please find page 69 of the 2010 EasyJet annual report below. You can navigate through the pages in the report by either clicking on the pages listed below, or by using the keyword search tool below to find specific information within the annual report.-
 1
1 -
2
-
3
-
4
-
5
-
6
-
7
-
8
-
9
-
10
-
11
-
12
-
13
-
14
-
15
-
16
-
17
-
18
-
19
-
20
-
21
-
22
-
23
-
24
-
25
-
26
-
27
-
28
-
29
-
30
-
31
-
32
-
33
-
34
-
35
-
36
-
37
-
38
-
39
-
40
-
41
-
42
-
43
-
44
-
45
-
46
-
47
-
48
-
49
-
50
-
51
-
52
-
53
-
54
-
55
-
56
-
57
-
58
-
 59
59 -
 60
60 -
 61
61 -
 62
62 -
 63
63 -
 64
64 -
 65
65 -
 66
66 -
 67
67 -
 68
68 -
 69
69 -
 70
70 -
 71
71 -
 72
72 -
 73
73 -
 74
74 -
 75
75 -
 76
76 -
 77
77 -
 78
78 -
 79
79 -
80
-
81
-
82
-
83
-
84
-
85
-
86
-
87
-
88
-
89
-
90
-
91
-
92
-
93
-
94
-
95
-
96
-
97
-
98
-
99
-
100
 |
 |

Overview Business review Governance Accounts Other information
easyJet plc
Annual report and accounts 2010
67
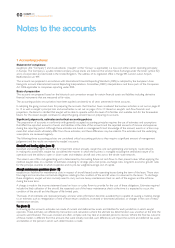
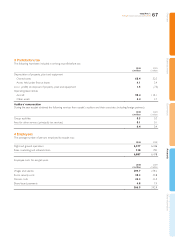
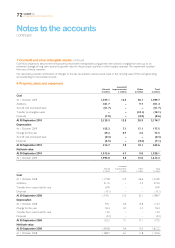
3 Profit before tax
The following have been included in arriving at profit before tax:
2010
£ million
2009
£ million
Depreciation of property, plant and equipment
Owned assets 68.4 52.0
Assets held under finance leases 4.1 3.4
Loss / (profit) on disposal of property, plant and equipment 1.5 (7.5)
Operating lease rentals
Aircraft 99.4 125.1
Other assets 3.4 2.7
Auditors’ remuneration
During the year easyJet obtained the following services from easyJet’s auditors and their associates (including foreign partners):
2010
£ million
2009
£ million
Group audit fee 0.3 0.3
Fees for other services (principally tax services) 0.1 0.1
0.4 0.4
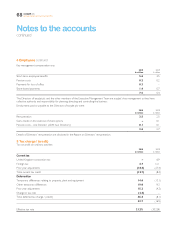
4 Employees
The average number of persons employed by easyJet was:
2010 2009
Flight and ground operations 6,577 6,186
Sales, marketing and administration 310 292
6,887 6,478
Employee costs for easyJet were:
2010
£ million
2009
£ million
Wages and salaries 299.7 279.2
Social security costs 39.2 33.8
Pension costs 23.2 22.5
Share-based payments 4.8 7.4
366.9 342.9