EasyJet 2010 Annual Report Download - page 82
Download and view the complete annual report
Please find page 82 of the 2010 EasyJet annual report below. You can navigate through the pages in the report by either clicking on the pages listed below, or by using the keyword search tool below to find specific information within the annual report.-
 1
1 -
2
-
3
-
4
-
5
-
6
-
7
-
8
-
9
-
10
-
11
-
12
-
13
-
14
-
15
-
16
-
17
-
18
-
19
-
20
-
21
-
22
-
23
-
24
-
25
-
26
-
27
-
28
-
29
-
30
-
31
-
32
-
33
-
34
-
35
-
36
-
37
-
38
-
39
-
40
-
41
-
42
-
43
-
44
-
45
-
46
-
47
-
48
-
49
-
50
-
51
-
52
-
53
-
54
-
55
-
56
-
57
-
58
-
59
-
60
-
61
-
62
-
63
-
64
-
65
-
66
-
67
-
68
-
69
-
70
-
71
-
 72
72 -
 73
73 -
 74
74 -
 75
75 -
 76
76 -
 77
77 -
 78
78 -
 79
79 -
 80
80 -
 81
81 -
 82
82 -
 83
83 -
 84
84 -
 85
85 -
 86
86 -
 87
87 -
 88
88 -
 89
89 -
 90
90 -
 91
91 -
 92
92 -
93
-
94
-
95
-
96
-
97
-
98
-
99
-
100
 |
 |

easyJet plc
Annual report and accounts 2010
Notes to the accounts
continued
80
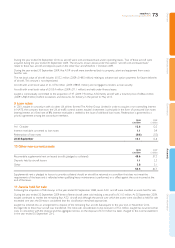
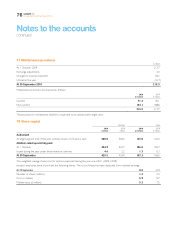
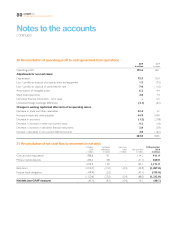
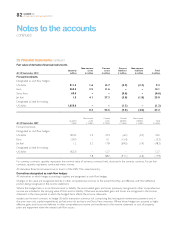
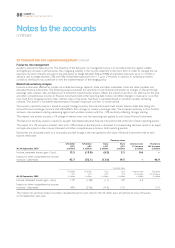
20 Reconciliation of operating profit to cash generated from operations
2010
£ million
2009
£ million
Operating profit 173.6 60.1
Adjustments for non-cash items:
Depreciation 72.5 55.4
Loss / (profit) on disposal of property, plant and equipment 1.5 (7.5)
Loss / (profit) on disposal of assets held for sale 7.0 (11.0)
Amortisation of intangible assets 6.2 4.4
Share-based payments 4.8 7.4
Derivative financial instruments – time value – 0.3
Unrealised foreign exchange differences (3.1) (6.2)
Changes in working capital and other items of an operating nature
Decrease in trade and other receivables 43.4 3.2
Increase in trade and other payables 44.9 104.9
Decrease in provisions (1.2) (27.8)
Decrease / (increase) in other non-current assets 9.2 (1.6)
Decrease / (increase) in derivative financial instruments 2.0 (0.9)
Increase / (decrease) in non-current deferred income 4.0 (16.2)
364.8 164.5
21 Reconciliation of net cash flow to movement in net debt
1 October
2009
£ million
Exchange
differences
£ million
Loan issue
costs
£ million
Net cash flow
£ million
30 September
2010
£ million
Cash and cash equivalents 788.6 9.1 – 114.2 911.9
Money market deposits 286.3 4.8 – (31.1) 260.0
1,074.9 13.9 – 83.1 1,171.9
Bank loans (1,010.7) (21.0) (0.4) (24.9) (1,057.0)
Finance lease obligations (109.9) (2.0) – (43.1) (155.0)
(1,120.6) (23.0) (0.4) (68.0) (1,212.0)
Net debt (non-GAAP measure) (45.7) (9.1) (0.4) 15.1 (40.1)