EasyJet 2010 Annual Report Download - page 20
Download and view the complete annual report
Please find page 20 of the 2010 EasyJet annual report below. You can navigate through the pages in the report by either clicking on the pages listed below, or by using the keyword search tool below to find specific information within the annual report.-
 1
1 -
2
-
3
-
4
-
5
-
6
-
7
-
8
-
9
-
 10
10 -
 11
11 -
 12
12 -
 13
13 -
 14
14 -
 15
15 -
 16
16 -
 17
17 -
 18
18 -
 19
19 -
 20
20 -
 21
21 -
 22
22 -
 23
23 -
 24
24 -
 25
25 -
 26
26 -
 27
27 -
 28
28 -
 29
29 -
 30
30 -
31
-
32
-
33
-
34
-
35
-
36
-
37
-
38
-
39
-
40
-
41
-
42
-
43
-
44
-
45
-
46
-
47
-
48
-
49
-
50
-
51
-
52
-
53
-
54
-
55
-
56
-
57
-
58
-
59
-
60
-
61
-
62
-
63
-
64
-
65
-
66
-
67
-
68
-
69
-
70
-
71
-
72
-
73
-
74
-
75
-
76
-
77
-
78
-
79
-
80
-
81
-
82
-
83
-
84
-
85
-
86
-
87
-
88
-
89
-
90
-
91
-
92
-
93
-
94
-
95
-
96
-
97
-
98
-
99
-
100
 |
 |
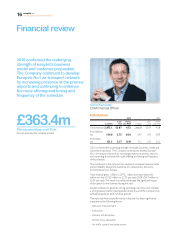
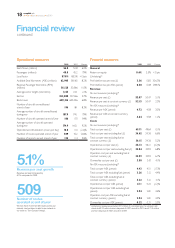
Financial review
continued
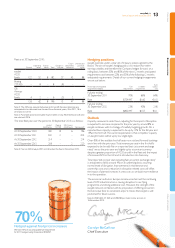
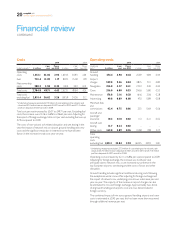
Revenue per seat growth
Revenue per seat increased by
5.1% compared to 2009.
5 .1%
Operational measures
2010 2009 Change
Seats own (millions) 56.0 52.8 6.0%
Passengers (millions) 48.8 45.2 7.9%
Load factor 87.0% 85.5% +1. 5pts
Available Seat Kilometres (ASK) (millions) 62,945 58,165 8.2%
Revenue Passenger Kilometres (RPK)
(millions) 56,128 50,566 11. 0 %
Average sector length (kilometres) 1,123 1,101 2.1%
Sectors 353,080 337,266 4.7%
Block hours 689,316 645,446 6.8%
Number of aircraft owned/leased
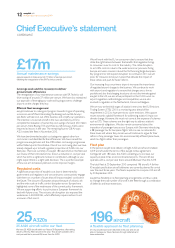
at end of year 196 181 8.3%
Average number of aircraft owned/leased
during year 187.9 174.1 7.9%
Number of aircraft operated at end of year 186 170 9.4%
Average number of aircraft operated
during year 174.9 160.1 9.2%
Operated aircraft utilisation (hours per day) 10.8 11. 0 (2.2)%
Number of routes operated at end of year 509 422 20.6%
Number of airports served at end of year 125 114 9.6%
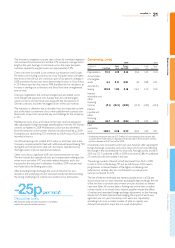
Financial measures
2010 2009 Change
General
Return on equity 8.6% 5.5% +3.1pts
(Underlying)*
Prot before tax per seat (£) 3.36 0.83 306.3%
Prot before tax per ASK (pence) 0.30 0.08 298.1%
Revenue
Per seat measures (underlying)*
Revenue per seat (£) 53.07 50.47 5.1%
Revenue per seat at constant currency (£) 52.15 50.47 3.3%
Per ASK measures (underlying)*
Revenue per ASK (pence) 4.72 4.58 3.0%
Revenue per ASK at constant currency
(pence) 4.64 4.58 1.2%
Costs
Per seat measures (underlying)*
Total cost per seat (£) 49.71 49.64 0.1%
Total cost per seat excluding fuel (£) 36.62 34.36 6.6%
Total cost per seat excluding fuel at
constant currency (£) 36.15 34.36 5.2%
Operational cost per seat (£) 46.13 46.21 (0.2)%
Operational cost per seat excluding fuel (£) 33.04 30.93 6.8%
Operation cost per seat excluding fuel at
constant currency (£) 32.99 30.93 6.7%
Ownership cost per seat (£) 3.58 3.43 4.1%
Per ASK measures (underlying)*
Total cost per ASK (pence) 4.43 4.51 (1.7)%
Total cost per ASK excluding fuel (pence) 3.26 3.12 4.4%
Total cost per ASK excluding fuel at
constant currency (pence) 3.22 3.12 3.1%
Operational cost per ASK (pence) 4.11 4.20 (2.2)%
Operational cost per ASK excluding fuel
(pence) 2.94 2.81 4.6%
Operation cost per ASK excluding fuel at
constant currency (pence) 2.94 2.81 4.5%
Ownership cost per ASK (pence) 0.32 0.31 2.0%
* Underlying measures exclude £27.3 million of cost relating to the volcanic ash
cloud and £7.0 million loss on disposal of A321 aircraft in 2010 and £11.0 million
profit on disposal of A321 aircraft in 2009.
Number of routes
operated at end of year
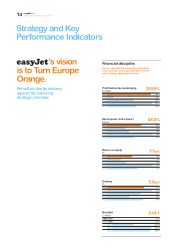
We now have more than 500 routes across our
network, and continue to add to our network in
our vision to ‘Turn Europe Orange’.
509
18 easyJet plc
Annual report and accounts 2010