EasyJet 2010 Annual Report Download - page 3
Download and view the complete annual report
Please find page 3 of the 2010 EasyJet annual report below. You can navigate through the pages in the report by either clicking on the pages listed below, or by using the keyword search tool below to find specific information within the annual report.-
 1
1 -
 2
2 -
 3
3 -
 4
4 -
 5
5 -
 6
6 -
 7
7 -
 8
8 -
 9
9 -
 10
10 -
 11
11 -
 12
12 -
 13
13 -
 14
14 -
15
-
16
-
17
-
18
-
19
-
20
-
21
-
22
-
23
-
24
-
25
-
26
-
27
-
28
-
29
-
30
-
31
-
32
-
33
-
34
-
35
-
36
-
37
-
38
-
39
-
40
-
41
-
42
-
43
-
44
-
45
-
46
-
47
-
48
-
49
-
50
-
51
-
52
-
53
-
54
-
55
-
56
-
57
-
58
-
59
-
60
-
61
-
62
-
63
-
64
-
65
-
66
-
67
-
68
-
69
-
70
-
71
-
72
-
73
-
74
-
75
-
76
-
77
-
78
-
79
-
80
-
81
-
82
-
83
-
84
-
85
-
86
-
87
-
88
-
89
-
90
-
91
-
92
-
93
-
94
-
95
-
96
-
97
-
98
-
99
-
100
 |
 |

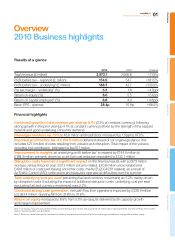
2010 2009 Change
Total revenue (£ million) 2,973.1 2,666.8 +11.5%
Profit before tax – reported (£ million) 154.0 54.7 +181.5%
Profit before tax – underlying1 (£ million) 188.3 43.7 +330.9%
Pre tax margin – underlying1 (%) 6.3 1.6 +4.7ppt
Return on equity (%) 8.6 5.5 +3.1ppt
Return on capital employed2 (%) 8.8 4.0 +4.8ppt
Basic EPS – (pence) 28.4p 16.9p +68.0%
Financial highlights
Continued growth in total revenue per seat up 5.1% (3.3% at constant currency), following
strong growth in the prior year (up 4.1% at constant currency) driven by the strength of the easyJet
network and good underlying consumer demand
Passenger numbers up 7.9% to 48.8 million and load factor increased by 1.5ppt to 87.0%
Reported profit before tax of £154.0 million delivered ahead of our original guidance, this
includes £27.3 million of costs resulting from volcanic ash disruption. Total impact of the volcano,
including lost contribution, estimated to be £57 million
Improvement in margins as underlying profit before tax1 increased by £144.6 million to
£188.3 million, primarily driven by a unit fuel cost reduction equivalent to £122.7 million
Disruption costs have had a significant impact on the financial results with a £97.9 million
increase versus the prior year. £27.3 million volcano related, £20.8 million snow related and
£49.8 million of costs (wet leasing and other costs, mainly EU2004/261 related), as a result of
Air Traffic Control (ATC) strike action and easyJet’s operational difficulties over the summer
Total underlying cost per seat1 (excluding fuel and currency movement) up 5.2% mainly driven
by disruption costs. Excluding the impact of additional disruption costs, underlying cost per seat1
(excluding fuel and currency movement) rose 2.2%
Continued strong cash generation, net cash flow from operations improved by £228.9 million
to £363.4 million. Gearing fell from 37.6% to 31.8%
Return on equity increased to 8.6% from 5.5% as easyJet delivered both capacity growth
and margin improvement
Note 1: Underlying measures exclude £27.3 million of cost relating to the volcanic ash cloud and £7.0 million loss on disposal of A321 aircraft in 2010 and £11.0 million
profit on disposal of A321 aircraft in 2009.
Note 2: Return on capital employed is calculated by dividing normalised operating profit after tax by average net debt plus average shareholders’ equity.
O v e r v i e w
2010 Business highlights
Results at a glance
Overview Business review Governance Accounts Other information
01
easyJet plc
Annual report and accounts 2010