EasyJet 2010 Annual Report Download - page 24
Download and view the complete annual report
Please find page 24 of the 2010 EasyJet annual report below. You can navigate through the pages in the report by either clicking on the pages listed below, or by using the keyword search tool below to find specific information within the annual report.-
 1
1 -
2
-
3
-
4
-
5
-
6
-
7
-
8
-
9
-
10
-
11
-
12
-
13
-
 14
14 -
 15
15 -
 16
16 -
 17
17 -
 18
18 -
 19
19 -
 20
20 -
 21
21 -
 22
22 -
 23
23 -
 24
24 -
 25
25 -
 26
26 -
 27
27 -
 28
28 -
 29
29 -
 30
30 -
 31
31 -
 32
32 -
 33
33 -
 34
34 -
35
-
36
-
37
-
38
-
39
-
40
-
41
-
42
-
43
-
44
-
45
-
46
-
47
-
48
-
49
-
50
-
51
-
52
-
53
-
54
-
55
-
56
-
57
-
58
-
59
-
60
-
61
-
62
-
63
-
64
-
65
-
66
-
67
-
68
-
69
-
70
-
71
-
72
-
73
-
74
-
75
-
76
-
77
-
78
-
79
-
80
-
81
-
82
-
83
-
84
-
85
-
86
-
87
-
88
-
89
-
90
-
91
-
92
-
93
-
94
-
95
-
96
-
97
-
98
-
99
-
100
 |
 |
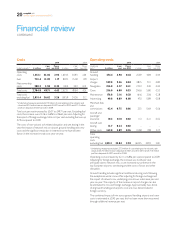
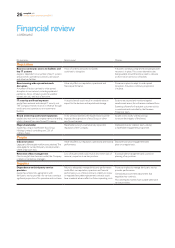
Financial review
continued
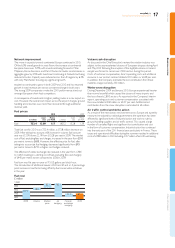
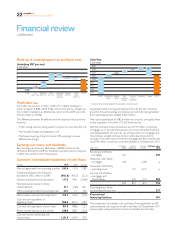
Build up of underlying pre-tax profit per seat
Profit after tax
Prot after tax was £121.3 million (2009: £71.2 million) resulting in a
return on equity of 8.6% (2009: 5.5%). The current year tax charge was
£32.7 million resulting in an effective tax rate of 21.2% (2009: tax credit
of£16.5 million or 30.2%).
The difference between the effective and the statutory rate is primarily
driven by:
– Prots arising overseas being subject to lower tax rates than the UK;
– Non-taxable foreign exchange gains; and
– The future lowering of the UK rate to 27% resulting in a lower
deferred tax charge.
Earnings per share and dividends
Basic earnings per share was 28.4 pence, a 68.0% increase on the
16.9 pence achieved in 2009. No dividends have been paid or proposed
in either the current or prior nancial year.
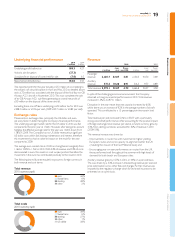
Summary consolidated statement of cash flows
easyJet generated a strong operating cash ow for the year; driven by
growth in forward bookings and revenue per seat. Net cash generated
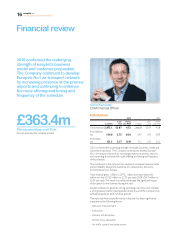
from operating activities totalled £363.4 million.
Net capital expenditure of £482.6 million was incurred, principally driven
by the acquisition of a further 27 A320 family aircraft.
Net loan and lease nance drawdown was £177.3 million, comprising
mortgages on 13 aircraft, nance leases on two aircraft and the sale and
operating leaseback of six aircraft, net of repayments on mortgages and
nance leases. easyJet continues to be an attractive proposition to
providers of aircraft nance in both the mortgage and lease markets and
had $754 million of undrawn committed facilities at 30 September 2010.
US$ million 1 October
2009 Facilities
negotiated Facilities
utilised 30 September
2010
Revolving credit facility
–mortgages 250 – – 250
December 2007 facility
–mortgages 278 –(278) –
November 2009 facility
–operating leases –222 (222) –
Summer 2010 facilities
– mortgages and
nanceleases –615 (111) 504
528 837 (611) 754
Operating leases facility
secured after the year end 237
Committed
nancingfacilities 991
The combination of available cash, committed nancing facilities and 38
unencumbered cash acquired aircraft in the eet at 30 September 2010
leaves easyJet well positioned to nance committed aircraft orders.
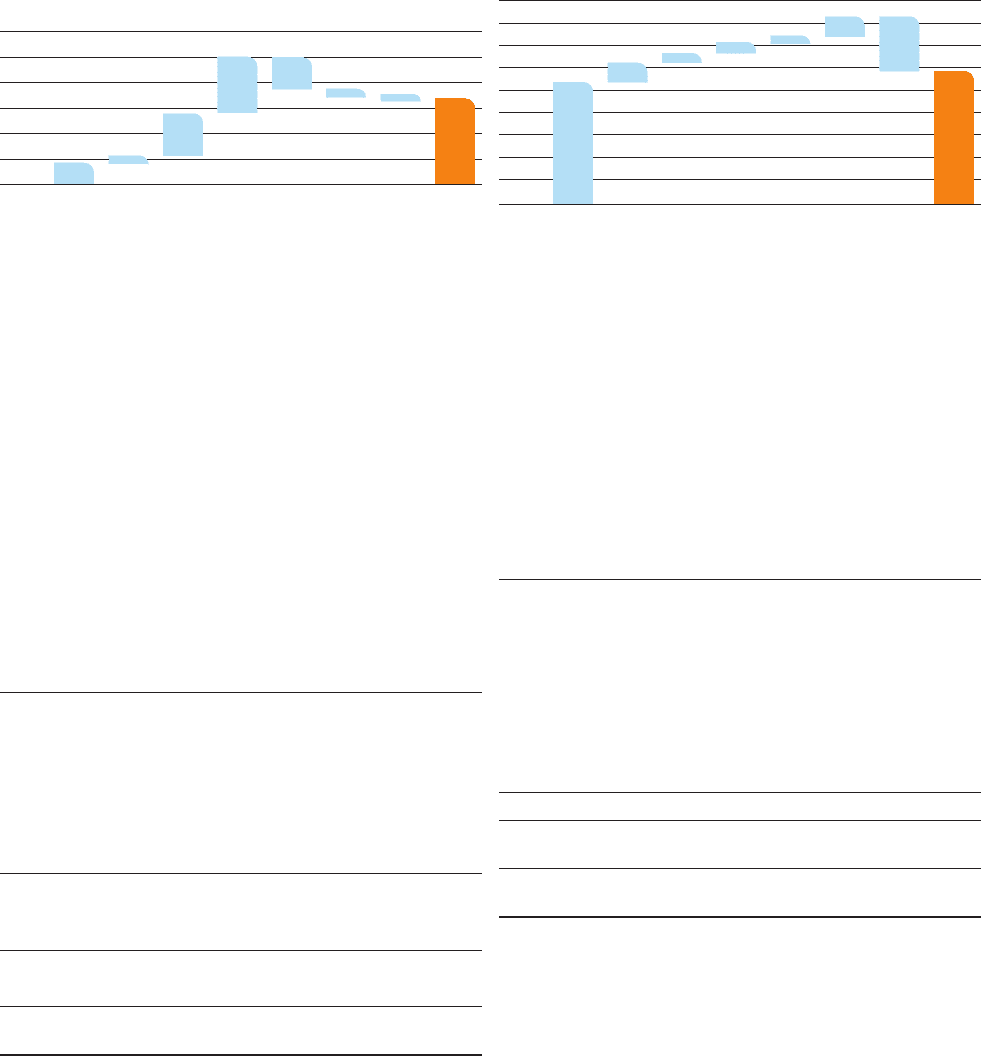
6
4
2009
0.83
0.26
1.68
2.19 1.25
0.23 0.12
3.36
FX
(excl. fuel)
Revenue
(excl. fx)
Fuel
(inc. fx)
Disruption
and wet
leasing
Interest
income
Other
price
and mix
2010
3
5
2
1
Underlying PBT per seat
£ per seat 1,800
1,200
2009*
*Includes money market deposits but excludes restricted cash.
1,075
17479 102
48 177483
1,172
Operating
profit
Depn &
amort
Net
working
capital
Tax, net
int, fx
and other
Financing Capex 2010*
1,000
1,600
1,400
800
600
400
200
Cash flow
£ per seat
£ million 2010 2009 Change
Net cash generated from operating activities 363.4 134. 5 228.9
Capital expenditure (net of disposal
proceeds of £90.2 million in 2009) (482.6) (430.3) (52.3)
Net loan and lease nance drawdown 177.3 470.1 (292.8)
Net decrease/(increase) in money
marketdeposits 31.1 (29.0) 60.1
Other including the effect of exchange rates 34.1 11.1 23.0
Net increase in cash and cash equivalents 123.3 156.4 (33.1)
Cash and cash equivalents at
beginningofyear 788.6 632.2 156.4
Cash and cash equivalents at end of year 911.9 788.6 123.3
Money market deposits at end of year 260.0 286.3 (26.3)
Cash and money market deposits
at end ofyear 1,171.9 1,074.9 97.0
22 easyJet plc
Annual report and accounts 2010