EasyJet 2010 Annual Report Download - page 72
Download and view the complete annual report
Please find page 72 of the 2010 EasyJet annual report below. You can navigate through the pages in the report by either clicking on the pages listed below, or by using the keyword search tool below to find specific information within the annual report.-
 1
1 -
2
-
3
-
4
-
5
-
6
-
7
-
8
-
9
-
10
-
11
-
12
-
13
-
14
-
15
-
16
-
17
-
18
-
19
-
20
-
21
-
22
-
23
-
24
-
25
-
26
-
27
-
28
-
29
-
30
-
31
-
32
-
33
-
34
-
35
-
36
-
37
-
38
-
39
-
40
-
41
-
42
-
43
-
44
-
45
-
46
-
47
-
48
-
49
-
50
-
51
-
52
-
53
-
54
-
55
-
56
-
57
-
58
-
59
-
60
-
61
-
 62
62 -
 63
63 -
 64
64 -
 65
65 -
 66
66 -
 67
67 -
 68
68 -
 69
69 -
 70
70 -
 71
71 -
 72
72 -
 73
73 -
 74
74 -
 75
75 -
 76
76 -
 77
77 -
 78
78 -
 79
79 -
 80
80 -
 81
81 -
 82
82 -
83
-
84
-
85
-
86
-
87
-
88
-
89
-
90
-
91
-
92
-
93
-
94
-
95
-
96
-
97
-
98
-
99
-
100
 |
 |

easyJet plc
Annual report and accounts 2010
Notes to the accounts
continued
70
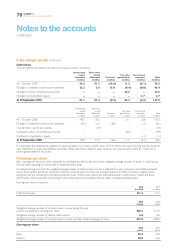
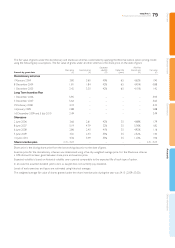
5 Tax charge / (credit) continued
Deferred tax
The net deferred tax liability included in the balance sheet is as follows;
Accelerated
capital
allowances
£ million
Short-term
timing
differences
£ million
Tax losses
£ million
Fair value
(gains)/losses
£ million
Share-based
payments
£ million
Total
£ million
At 1 October 2009 35.5 51.7 (16.0) 11.2 (6.1) 76.3
Charged / (credited) to the income statement 26.2 5.6 15.8 (0.4) (0.8) 46.4
Charged to other comprehensive income – – – 22.5 – 22.5
Charged to shareholders’ equity – – – – 2.7 2.7
At 30 September 2010 61.7 57.3 (0.2) 33.3 (4.2) 147.9
Accelerated
capital
allowances
£ million
Short-term
timing
differences
£ million
Tax losses
£ million
Fair value
(gains)/losses
£ million
Share-based
payments
£ million
Total
£ million
At 1 October 2008 49.7 30.3 – 31.1 (3.8) 107.3
Charged / (credited) to the income statement (14.2) 23.3 (16.0) – (1.2) (8.1)
Transfer from current tax liabilities – (1.9) – – – (1.9)
Credited to other comprehensive income – – – (19.9) – (19.9)
Credited to shareholders’ equity – – – – (1.1) (1.1)
At 30 September 2009 35.5 51.7 (16.0) 11.2 (6.1) 76.3
It is estimated that deferred tax liabilities of approximately £12.2 million (2009: assets of £7.4 million) will reverse during the next financial
year. Deferred tax assets and liabilities have been offset where they relate to taxes levied by the same taxation authority. There are no
unrecognised deferred tax assets.
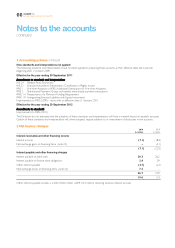
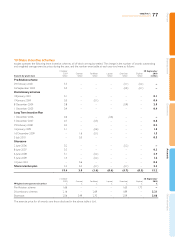
6 Earnings per share
Basic earnings per share has been calculated by dividing the profit for the year by the weighted average number of shares in issue during
the year after adjusting for shares held in employee share trusts.
For diluted earnings per share, the weighted average number of ordinary shares in issue is adjusted to assume conversion of all dilutive potential
shares. Share options granted to employees where the exercise price is less than the average market price of the Company’s ordinary shares
during the year are considered to be dilutive potential shares. Where share options are exercisable based on performance criteria and those
performance criteria have been met during the year, these options are included in the calculation of dilutive potential shares.
Earnings per share is based on:
2010
£ million
2009
£ million
Profit for the year 121.3 71.2
2010
million
2009
million
Weighted average number of ordinary shares in issue during the year
used to calculate basic earnings per share 426.5 421.9
Weighted average number of dilutive share options 6.0 6.4
Weighted average number of ordinary shares used to calculate diluted earnings per share 432.5 428.3
Earnings per share
2010
pence
2009
pence
Basic 28.4 16.9
Diluted 28.0 16.6