EasyJet 2010 Annual Report Download - page 19
Download and view the complete annual report
Please find page 19 of the 2010 EasyJet annual report below. You can navigate through the pages in the report by either clicking on the pages listed below, or by using the keyword search tool below to find specific information within the annual report.-
 1
1 -
2
-
3
-
4
-
5
-
6
-
7
-
8
-
 9
9 -
 10
10 -
 11
11 -
 12
12 -
 13
13 -
 14
14 -
 15
15 -
 16
16 -
 17
17 -
 18
18 -
 19
19 -
 20
20 -
 21
21 -
 22
22 -
 23
23 -
 24
24 -
 25
25 -
 26
26 -
 27
27 -
 28
28 -
 29
29 -
30
-
31
-
32
-
33
-
34
-
35
-
36
-
37
-
38
-
39
-
40
-
41
-
42
-
43
-
44
-
45
-
46
-
47
-
48
-
49
-
50
-
51
-
52
-
53
-
54
-
55
-
56
-
57
-
58
-
59
-
60
-
61
-
62
-
63
-
64
-
65
-
66
-
67
-
68
-
69
-
70
-
71
-
72
-
73
-
74
-
75
-
76
-
77
-
78
-
79
-
80
-
81
-
82
-
83
-
84
-
85
-
86
-
87
-
88
-
89
-
90
-
91
-
92
-
93
-
94
-
95
-
96
-
97
-
98
-
99
-
100
 |
 |
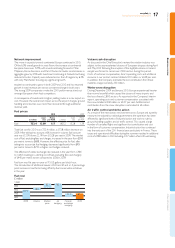
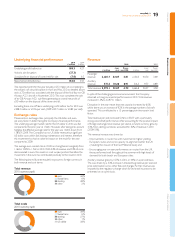
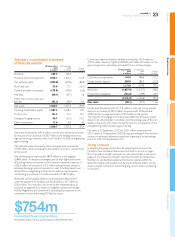
Network improvement
The move in capacity towards continental Europe continued in 2010.
Ofthe 6.0% overall growth in seats own, the increase at continental
European bases was 15.9%, with investment being focused in Milan
Malpensa, Rome Fiumicino, and Paris Charles de Gaulle. London bases in
aggregate grew by 4.5% with investment continuing at Gatwick but being
reduced at Luton. Capacity was reduced across the UK regions by 6.3%
with only Manchester showing any signicant growth.
easyJet has continued to grow in both 2009 and 2010 and has returned
growth in total revenue per seat at constant exchange in both years.
Thestrong 2009 comparators make the 2010 performance stand out
amongst European short-haul competitors.
A consequence of investment in higher yielding routes is a mix impact on
cost. However, the overall cost impact across the airport charges, ground
handling and crew lines was more than recovered through additional
revenue yield.
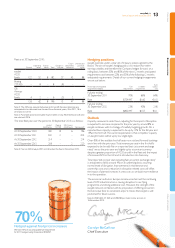
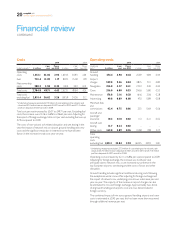
Fuel prices
2010 2009
£ million £ per
seat Pence
per ASK £ million £ per
seat Pence
per ASK
Fuel 733.4 13.09 1.17 807.2 15.28 1.39
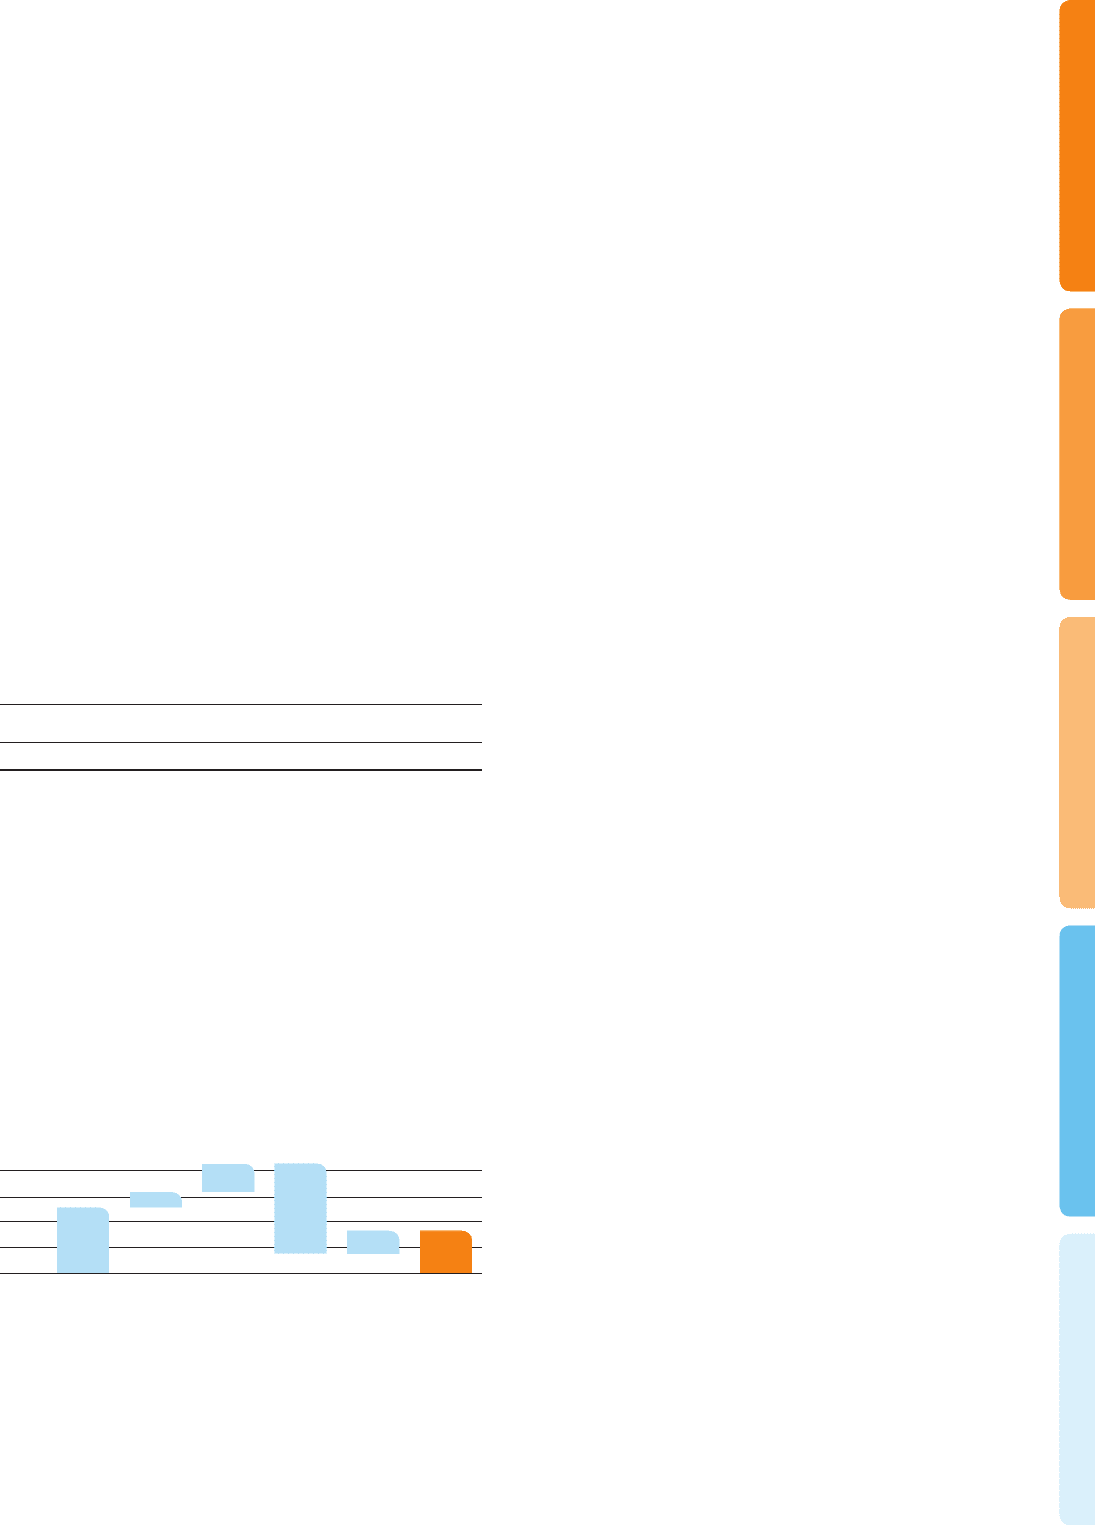
Total fuel cost for 2010 was £733.4 million, a £73.8 million decrease on
2009. After taking into account a 6% increase in volume, fuel cost per
seat was £13.09, down £2.19 from £15.28 per seat in 2009. The market
cost of fuel, excluding fees and charges, increased in the year from $595
per metric tonne to $688. However, the effective price for fuel, after
taking into account jet fuel hedging, decreased signicantly from $951
permetric tonne to $732 as higher cost hedges matured.
The effective US dollar exchange rate reduced in the year from 1.78/£
to1.64/£ resulting in a sterling cost of fuel (excluding fees and charges)
of£445 per metric tonne compared to £536 in 2009.
Fuel burn was at year-on-year at 715 US gallons per block hour.
Theintroduction of additional heavier A320 aircraft and a 1.5 percentage
point increase in load factor being offset by fuel conservation initiatives
inthe year.
Volcanic ash disruption
As discussed in the Chief Executive’s review, the aviation industry was
subject to the unprecedented closures of European airspace during April
and May 2010 following the eruption of the Eyjafjalla volcano in Iceland.
easyJet was forced to cancel over 7,000 sectors during this period.
Costsof customer compensation, direct operating costs and additional
resource in our contact centres totalled £27.3 million or £0.49 per seat.
In addition, the Company estimates the lost contribution from these
incidents at approximately £30 million.
Winter snow disruption
During December 2009 and January 2010, Europe experienced heavier
than normal snowfall which caused the closure of many airports and
theloss of nearly 2,800 sectors. As reported in the Company’s interim
report, operating costs and customer compensation associated with
thesnow totalled £20.8 million or £0.37 per seat. Additional lost
contribution from the snow disruption is estimated at £4 million.
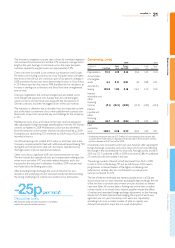
Air traffic control and strike action
As a result of the recessionary environment across Europe and austerity
measures introduced by national governments the operation has been
affected by signicant levels of industrial action and work to rule by
ground handling suppliers and air trafc control. This caused a large
number of cancelled ights and signicant lost contribution and cost
inthe form of customer compensation. Industrial action has continued
into the early part of the 2011 nancial year particularly in France. These
issues and operational difculties during the summer resulted in additional
costs of £49.8 million in 2010 including £13.7 million of aircraft wet leasing.
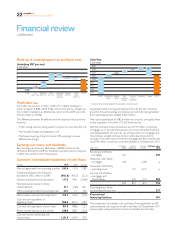
807.2
1,000
800
2009
48.9
89.3 286.3
74.3 733.4
VolumeMarket
price
Jet
hedging
Foreign
exchange
hedging
2010
700
900
600
Fuel cost
£ million
Overview Business review Governance Accounts Other information
17
easyJet plc
Annual report and accounts 2010