EasyJet 2010 Annual Report Download - page 17
Download and view the complete annual report
Please find page 17 of the 2010 EasyJet annual report below. You can navigate through the pages in the report by either clicking on the pages listed below, or by using the keyword search tool below to find specific information within the annual report.-
 1
1 -
2
-
3
-
4
-
5
-
6
-
 7
7 -
 8
8 -
 9
9 -
 10
10 -
 11
11 -
 12
12 -
 13
13 -
 14
14 -
 15
15 -
 16
16 -
 17
17 -
 18
18 -
 19
19 -
 20
20 -
 21
21 -
 22
22 -
 23
23 -
 24
24 -
 25
25 -
 26
26 -
 27
27 -
28
-
29
-
30
-
31
-
32
-
33
-
34
-
35
-
36
-
37
-
38
-
39
-
40
-
41
-
42
-
43
-
44
-
45
-
46
-
47
-
48
-
49
-
50
-
51
-
52
-
53
-
54
-
55
-
56
-
57
-
58
-
59
-
60
-
61
-
62
-
63
-
64
-
65
-
66
-
67
-
68
-
69
-
70
-
71
-
72
-
73
-
74
-
75
-
76
-
77
-
78
-
79
-
80
-
81
-
82
-
83
-
84
-
85
-
86
-
87
-
88
-
89
-
90
-
91
-
92
-
93
-
94
-
95
-
96
-
97
-
98
-
99
-
100
 |
 |
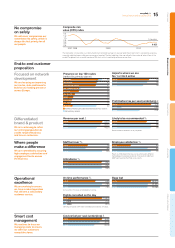
Smart cost
management
No compromise
on safety
We will never compromise our
commitment to safety, which is
always the first priority for all
our people.
End-to-end customer
proposition
Focused on network
development
We are focusing on improving
our routes, slots and bases to
build on our leading presence
across Europe.
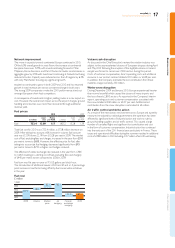
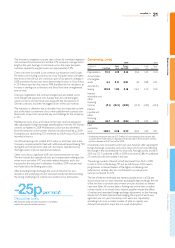
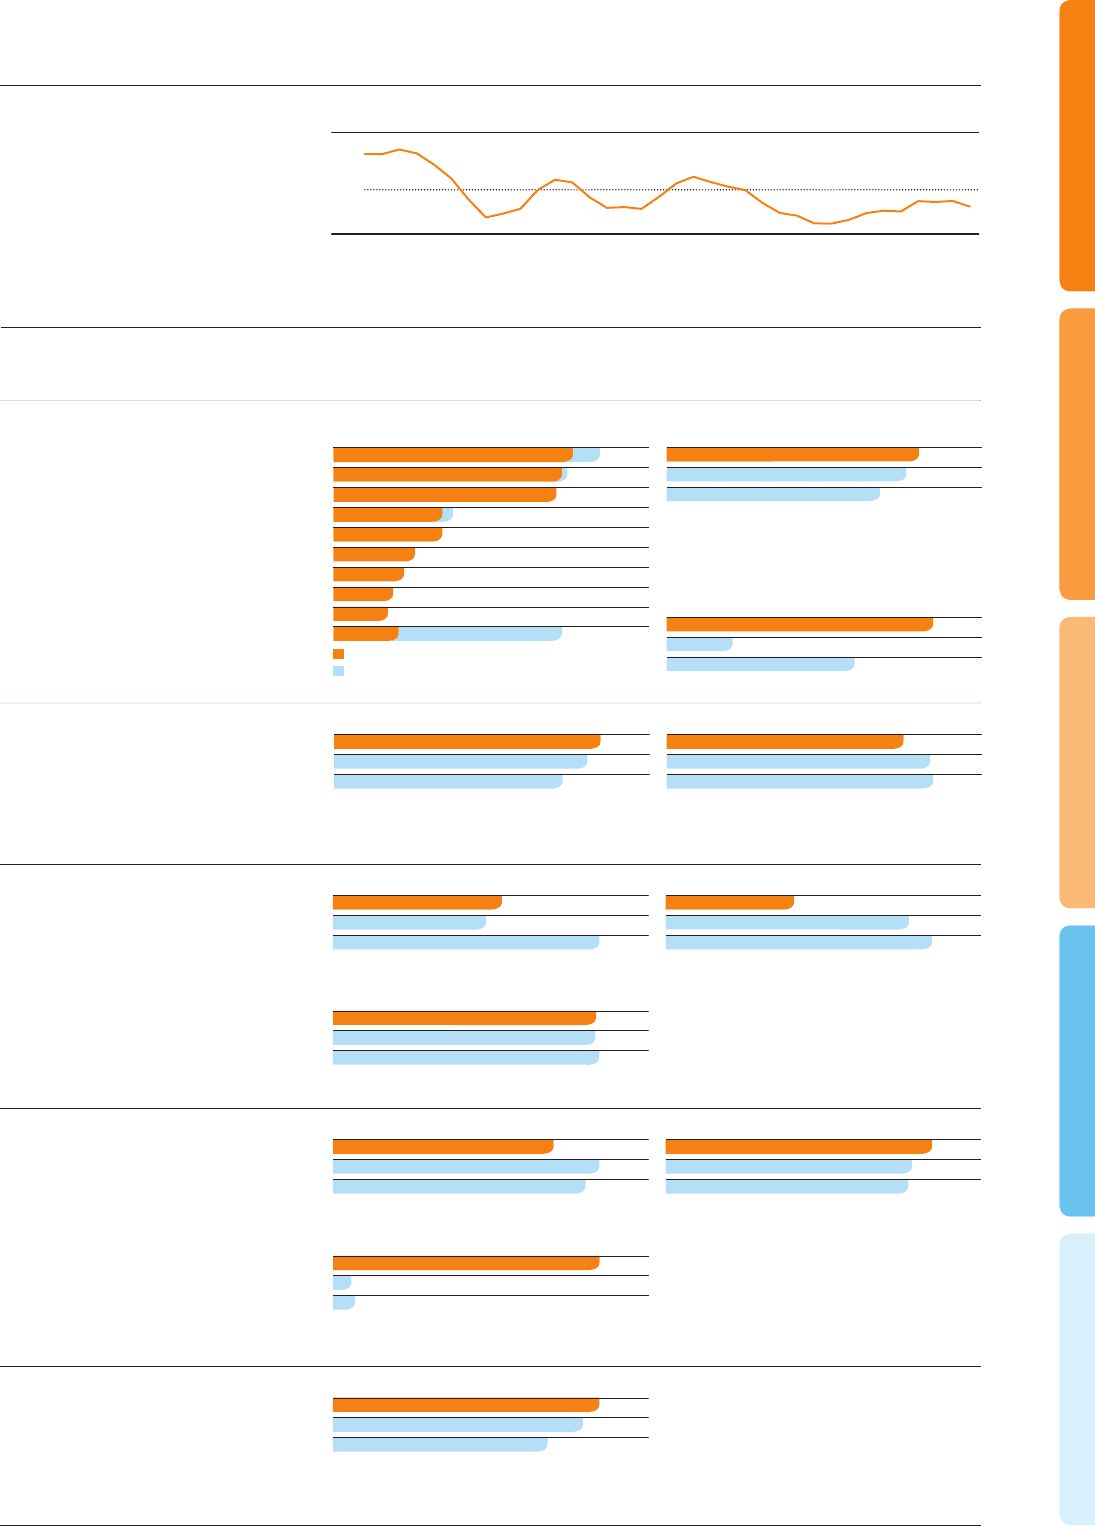
The Composite risk value index is an internal benchmark to monitor average risk value per sector own over time. It is calculated by assigning a
numerical weighting to every safety occurrence report received. The total weighting is then normalised by the number of sectors own in the
period. Management sets a nominal boundary of 0.8 which assists in monitoring performance over time.
Composite risk
value (CRV) index
2007 2008 2009 2010
0.625
0.8 boundary
1.2
1.4
1.0
0.8
0.6
0.4
41
22
43
49
20
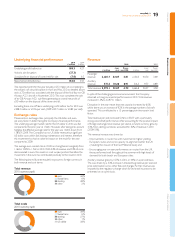
Presence on top 100 routes
(ranked by primary airport)
Lufthansa-Swiss
Air France-KLM
BA/Iberia
Alitalia
15
13
Air Berlin
SAS
10
11
Vueling
Norwegian
42
Ryanair
easyJet
Number of market pairs operated between primary airports
Non-primary airports
19
18
16
Airports where we are
No.1 or No.2 airline
2010
2009
2008
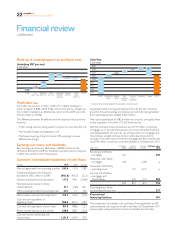
3.36
0.83
2.37
Profit before tax per seat (underlying) £
2010
2009
2008
We continue to focus on
managing coststo ensure
we offer our customers
competitive fares.
36.62
34.36
29.49
Cost ex fuel per seat (underlying) £
2010
2009
2008
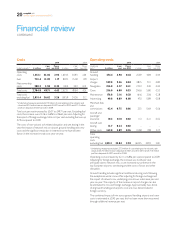
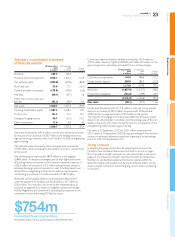
Where people
make a difference
We are committed to ensuring
high employee satisfaction and
engagement levels across
the business.
Results in 2010 relate to the uSay survey, which used a different
methodology to calculate satisfaction. The results for 2008 and
2009 were based on the Pulse survey results.
Results based on customer survey responses.
35
66
72
Employee satisfaction %
2010
2009
2008
7.6
6.9
12.0
Staff turnover %
2010
2009
2008
95.3
95.2
96.5
Attendance %
2010
2009
2008
Operational
excellence
We are working to ensure
we have arobust operation
that delivers a satisfactory
customer service.
Arrival within 15 minutes of scheduled arrival time.
65.8
79.5
75.4
On time performance %
2010
2009
2008
99,419
91,930
90,388
Bags lost
2010
2009
2008
2010 gure includes 7,314 ights cancelled due to volcanic ash cloud.
15,976
1,102
1,315
Flights cancelled on the day
2010
2009
2008
Differentiated
brand & product
We are continuing to refine
our winning proposition to
a wide range of business
and leisure customers.
50.47
53.07
45.51
Revenue per seat £
2010
2009
2008
80
89
90
Likely to be recommended %
2010
2009
2008
Overview Business review Governance Accounts Other information
15
easyJet plc
Annual report and accounts 2010