EasyJet 2010 Annual Report Download - page 22
Download and view the complete annual report
Please find page 22 of the 2010 EasyJet annual report below. You can navigate through the pages in the report by either clicking on the pages listed below, or by using the keyword search tool below to find specific information within the annual report.-
 1
1 -
2
-
3
-
4
-
5
-
6
-
7
-
8
-
9
-
10
-
11
-
 12
12 -
 13
13 -
 14
14 -
 15
15 -
 16
16 -
 17
17 -
 18
18 -
 19
19 -
 20
20 -
 21
21 -
 22
22 -
 23
23 -
 24
24 -
 25
25 -
 26
26 -
 27
27 -
 28
28 -
 29
29 -
 30
30 -
 31
31 -
 32
32 -
33
-
34
-
35
-
36
-
37
-
38
-
39
-
40
-
41
-
42
-
43
-
44
-
45
-
46
-
47
-
48
-
49
-
50
-
51
-
52
-
53
-
54
-
55
-
56
-
57
-
58
-
59
-
60
-
61
-
62
-
63
-
64
-
65
-
66
-
67
-
68
-
69
-
70
-
71
-
72
-
73
-
74
-
75
-
76
-
77
-
78
-
79
-
80
-
81
-
82
-
83
-
84
-
85
-
86
-
87
-
88
-
89
-
90
-
91
-
92
-
93
-
94
-
95
-
96
-
97
-
98
-
99
-
100
 |
 |

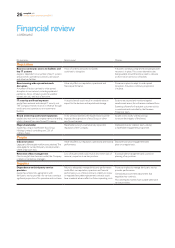
Financial review
continued
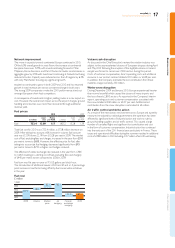
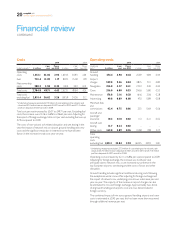
Costs 2010 2009
Underlying costs * £ million £ per
seat Pence
per ASK £ million £ per
seat Pence
per ASK
Operating
costs 1,851.1 33.04 2.94 1,634.5 30.93 2.81
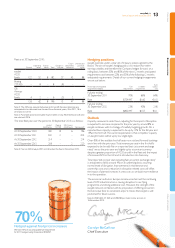
Fuel 733.4 13.09 1.17 807.2 15.28 1.39
Net ownership
costs 200.3 3.58 0.32 181.4 3.43 0.31
Total costs 2,784.8 49.71 4.43 2,623.1 49.64 4.51
Total costs
excluding fuel 2,051.4 36.62 3.26 1,815.9 34.36 3.12
* Underlying measures exclude £27.3 million of cost relating to the volcanic ash
cloud and £7.0 million loss on disposal of A321 aircraft in 2010 and £11.0 million
profit on disposal of A321 aircraft in 2009.
Total cost per seat increased by £0.07 to £49.71 per seat. Excluding fuel
costs, the increase was £2.26 or 6.6% to £36.62 per seat. Adjusting for
the impact of foreign exchange, total cost per seat excluding fuel was up
5.2% compared to 2009.
The costs of non-volcanic ash related disruption and wet leasing in the
year, the impact of network mix on airport, ground handling and crew
costs and the signicant reduction in interest income have all been
factors in the increase in total costs year-on-year.
Operating costs 2010 2009
Underlying
costs * £ million £ per
seat Pence
per ASK £ million £ per
seat Pence
per ASK
Ground
handling 274.4 4.90 0.44 255.9 4.84 0.44
Airport
charges 529.8 9.46 0.84 481.5 9.11 0.83
Navigation 256.0 4.57 0.41 232.3 4.40 0.40
Crew 336.0 6.00 0.53 306.6 5.80 0.53
Maintenance 176.8 3.16 0.28 161.6 3.06 0.28
Advertising 49.8 0.89 0.08 47.0 0.89 0.08
Merchant fees
and
commissions 42.4 0.75 0.06 33.5 0.64 0.06
Aircraft and
passenger
insurance 10.2 0.18 0.02 11.3 0.21 0.02
Aircraft wet
leasing 13.7 0.24 0.02 –––
Other costs 162.0 2.89 0.26 104.8 1.98 0.17
Total
operating
costs
excluding fuel 1,851.1 33.04 2.94 1,634.5 30.93 2.81
* Underlying measures exclude £27.3 million of cost relating to the volcanic ash
cloud and £7.0 million loss on disposal of A321 aircraft in 2010 and £11.0 million
profit on disposal of A321 aircraft in 2009.
Operating costs increased by £2.11 or 6.8% per seat compared to 2009.
Adjusting for foreign exchange, the increase was £2.06 per seat
principally due to network mix, as we increased our presence in the
topEuropean airports, wet leasing and the costs of snow and other
disruption.
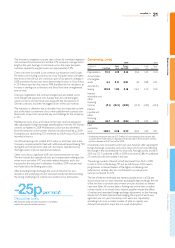
Ground handling includes signicant additional de-icing costs following
the exceptional winter snow. After adjusting for foreign exchange and
theimpact of network mix, underlying price shows a decrease per seat
year-on-year. The majority of the increase in airport charges can also
beattributed to mix and foreign exchange. Approximately two-thirds
ofallground handling and airports costs are now denominated in
foreigncurrency.
The combined impact of mix across ground handling, airports and crew
costs is estimated at £0.45 per seat, this has been more than recovered
through additional revenue per seat.
20 easyJet plc
Annual report and accounts 2010