EasyJet 2010 Annual Report Download - page 23
Download and view the complete annual report
Please find page 23 of the 2010 EasyJet annual report below. You can navigate through the pages in the report by either clicking on the pages listed below, or by using the keyword search tool below to find specific information within the annual report.-
 1
1 -
2
-
3
-
4
-
5
-
6
-
7
-
8
-
9
-
10
-
11
-
12
-
 13
13 -
 14
14 -
 15
15 -
 16
16 -
 17
17 -
 18
18 -
 19
19 -
 20
20 -
 21
21 -
 22
22 -
 23
23 -
 24
24 -
 25
25 -
 26
26 -
 27
27 -
 28
28 -
 29
29 -
 30
30 -
 31
31 -
 32
32 -
 33
33 -
34
-
35
-
36
-
37
-
38
-
39
-
40
-
41
-
42
-
43
-
44
-
45
-
46
-
47
-
48
-
49
-
50
-
51
-
52
-
53
-
54
-
55
-
56
-
57
-
58
-
59
-
60
-
61
-
62
-
63
-
64
-
65
-
66
-
67
-
68
-
69
-
70
-
71
-
72
-
73
-
74
-
75
-
76
-
77
-
78
-
79
-
80
-
81
-
82
-
83
-
84
-
85
-
86
-
87
-
88
-
89
-
90
-
91
-
92
-
93
-
94
-
95
-
96
-
97
-
98
-
99
-
100
 |
 |
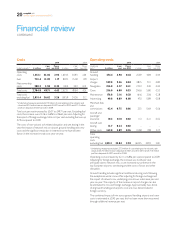
The increase in navigation costs per seat is driven by continued regulated
cost increases from Eurocontrol and the 2.1% increase in average sector
length in the year. Average cost increases across the major European
countries covered by easyJet routes was approximately 3.5%.
Crew costs have increased as we continue our expansion into Europe.
Per head costs including social security at our European bases are higher
than those in the UK but are a necessary part of our growth strategy. In
2009 one third of crew costs were denominated in euro or Swiss francs,
in 2010 this proportion has risen to 40% therefore this has resulted in an
increase in sterling cost as the euro and Swiss franc have strengthened
year-on-year.
Crew pay negotiations and contract changes have also added cost in
2010. Despite the expansion into Europe, the UK is still the largest
country in terms of crew heads and, along with the introduction of
German contracts, has been the biggest driver of the cost increase.
The reduction in utilisation due to disruption has also impacted cost per
seat as the xed cost element of our crew establishment is spread over
fewer seats. Crew costs remain the key cost challenge for the Company
in 2011.
Maintenance costs show an increase of £0.10 per seat but decreased
after adjusting for foreign exchange, beneting from the new SR Technics
contract completed in 2009. Maintenance costs have also beneted
fromthe reduction in the number of leased aircraft compared to 2009.
During the year nine Boeing 737s and three ex-GB Airways A320s were
returned to lessors.
Aircraft wet leasing costs totalled £13.7 million or £0.24 per seat as the
Company complemented its eet with additional wet leased Boeing 757s
during the summer period to deal with short-term operational crew
shortages and to improve operational resilience.
Other costs show a signicant £0.91 per seat increase year-on-year.
Thisline includes the operational costs and compensation relating to the
winter snow and other ATC and strike related disruption and is also
impacted by the reduction in utilisation. In addition 2009 cost per seat
was attered by the Boeing spares sale.
After excluding foreign exchange, the costs of network mix and
disruption, the underlying cost per seat was broadly at, demonstrating
the strong underlying cost control now evident across the business.
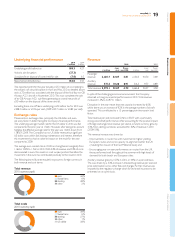
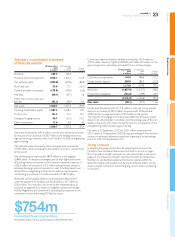
Ownership costs 2010 2009
Underlying
costs * £ million £ per
seat Pence
per ASK £ million £ per
seat Pence
per ASK
Depreciation 72.5 1.29 0.12 55.4 1.05 0.10
Amortisation
of intangible
assets 6.2 0.11 0.01 4.4 0.08 0.01
Aircraft dry
leasing 102.0 1.82 0.16 116 . 2 2.20 0.20
Interest
receivable and
other
nancing
income (7.1) (0.13) (0.01) (22.5) (0.43) (0.04)
Interest
payable and
other
nancing
charges 26.7 0.49 0.04 27.9 0.53 0.04
Net
ownership
costs 200.3 3.58 0.32 181.4 3.43 0.31
* Underlying measures exclude £27.3 million of cost relating to the volcanic ash
cloud and £7.0 million loss on disposal of A321 aircraft in 2010 and £11.0 million
profit on disposal of A321 aircraft in 2009.
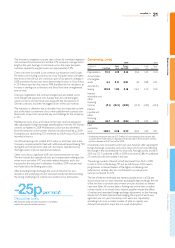
Ownership costs increased by £0.15 per seat, however after adjusting for
foreign exchange, ownership costs were down £0.25 per seat reecting
the change in the owned/leased mix of aircraft. Average owned aircraftin
2010 was 123.7 compared to 98.1 in 2009 an increase of 26%. An additional
23 owned aircraft were added in the year.
The average number of leased aircraft decreased from 76.0 in 2009
to64.2 in 2010 as the Boeing 737 and ex-GB Airways A320 return
programmes continued. Return of the higher cost Boeings and
reductions in variable rates also contributed to a positive price
variancecompared to 2010.
The net of interest receivable and interest payable shows a £0.26 per
seat increase year-on-year. However, excluding foreign exchange, the net
of the two lines is constant year-on-year on a per seat basis as interest
rates have fallen. All current debt is oating rate and re-xes on either
athree month orsix month basis. Interest payable includes the effects
ofrealised and unrealised foreign exchange adjustments on the nancing
element of USdollar balance sheet hedging, the impact of which was
signicant year-on-year. Ownership costs were also impacted by
spreading costs over a smaller number of seats as capacity was
reducedand utilisation impacted as a result of disruption.
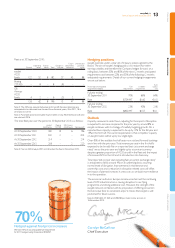
Ownership costs
We achieved a 25p per seat reduction in ownership
costs in the year at constant currency.
-25p per seat
Overview Business review Governance Accounts Other information
21
easyJet plc
Annual report and accounts 2010