EasyJet 2010 Annual Report Download - page 21
Download and view the complete annual report
Please find page 21 of the 2010 EasyJet annual report below. You can navigate through the pages in the report by either clicking on the pages listed below, or by using the keyword search tool below to find specific information within the annual report.-
 1
1 -
2
-
3
-
4
-
5
-
6
-
7
-
8
-
9
-
10
-
 11
11 -
 12
12 -
 13
13 -
 14
14 -
 15
15 -
 16
16 -
 17
17 -
 18
18 -
 19
19 -
 20
20 -
 21
21 -
 22
22 -
 23
23 -
 24
24 -
 25
25 -
 26
26 -
 27
27 -
 28
28 -
 29
29 -
 30
30 -
 31
31 -
32
-
33
-
34
-
35
-
36
-
37
-
38
-
39
-
40
-
41
-
42
-
43
-
44
-
45
-
46
-
47
-
48
-
49
-
50
-
51
-
52
-
53
-
54
-
55
-
56
-
57
-
58
-
59
-
60
-
61
-
62
-
63
-
64
-
65
-
66
-
67
-
68
-
69
-
70
-
71
-
72
-
73
-
74
-
75
-
76
-
77
-
78
-
79
-
80
-
81
-
82
-
83
-
84
-
85
-
86
-
87
-
88
-
89
-
90
-
91
-
92
-
93
-
94
-
95
-
96
-
97
-
98
-
99
-
100
 |
 |
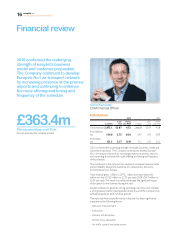
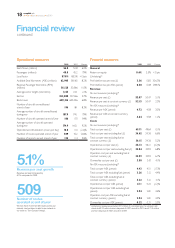
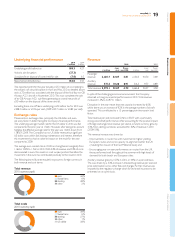
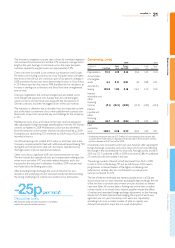
Underlying financial performance 2010
£ million 2009
£ million
Underlying prot before tax 188.3 43.7
Volcanic ash disruption (27.3) –
(Loss)/prot on disposal of assets held for sale (7.0) 11.0
Reported prot before tax 154.0 54.7
The reported prot for the year includes £27.3 million of cost relating to
the volcanic ash cloud disruption in April and May 2010 as detailed above
and a £7.0 million loss associated with the disposal of the nal four ex-GB
Airways A321 aircraft in November 2010. This now completes the sale
of ex-GB Airways A321 sub-eet, generating an overall net prot of
£4.0million on the disposal of the seven aircraft.
Excluding these one off items underlying prot before tax for 2010 was
£188.3 million or £3.36 per seat (2009: £43.7 million or £0.83 per seat).
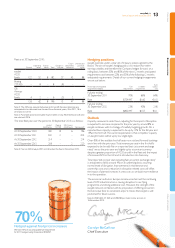
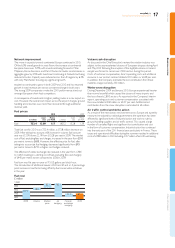
Exchange rates
Movements in exchange rates, principally the US dollar and euro,
are akeyfactor in determining the Company’s nancial performance.
Theunderlying average market rate for the US dollar in 2010 was at
compared to the prior year at 1.56/£. However, after taking into account
hedging, the effective average rate for the year was 1.64/£, down from
1.78/£ in 2009. The Company has no US dollar revenue but signicant
US dollar costs within fuel, leasing, maintenance and interest, therefore
this movement has had an adverse impact on the result for the year
compared to 2009.
The average euro market rate in 2010 has strengthened marginally from
1.16/£ in 2009 to 1.15/£ in 2010. With 44% of revenue and 34% of costs
denominated in euro, this results in a net surplus position therefore the
movement in the euro has contributed positively to the result in 2010.
The following charts illustrate easyJet’s exposure to foreign currency in
both revenue and cost terms:
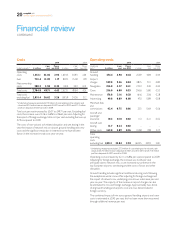
Revenue
2010 2009
£ million £ per
seat Pence
per ASK £ million £ per
seat Pence
per ASK
Passenger
revenue 2,401.7 42.87 3.81 2,150.5 40.70 3.69
Ancillary
revenue 571.4 10.20 0.91 516.3 9.77 0.89
Total revenue 2,973.1 53.07 4.72 2,666.8 50.47 4.58
In spite of the challenging economic environment, the Company
returned a strong commercial performance in 2010. Total revenue
increased 11.5% to £2,973.1 million.
Disruption in the year meant that seat capacity increased by 6.0%
whilstthere was an increase of 9.2% in the average number of aircraft
operated. This contributed to a 1.5 percentage point increase in load
factor.
Total revenue per seat increased 5.1% to £53.07 with a particularly
strong second half performance. After accounting for the positive impact
of foreign exchange, total revenue per seat at constant currency grew by
3.3%. Non-sterling currencies accounted for 52% of revenue in 2010
(2009: 51%).
This revenue increase was driven by:
– Improvements in route mix with investment in higher yielding
European routes and some capacity re-alignment within the UK
(including the closure of the East Midlands base); and
– Encouraging year-on-year performance on routes from the UK,
these performed well throughout the summer with high levels of
demand for both beach and European cities.
Ancillary revenue grew by 10.7% in 2010, or 4.4% on a per seat basis.
This was driven by a 3.3% increase in checked bag revenue per seat and
price optimisation across other fees and charges. Partner revenue was
impacted by the regulatory change which forced travel insurance to be
presented on an opt-in basis.
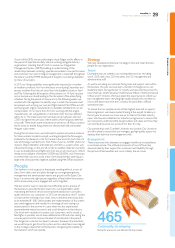
Total revenue
2010 currency split
■
euro 44%
■
Swiss franc 6%
■
sterling 48%
■
other 2%
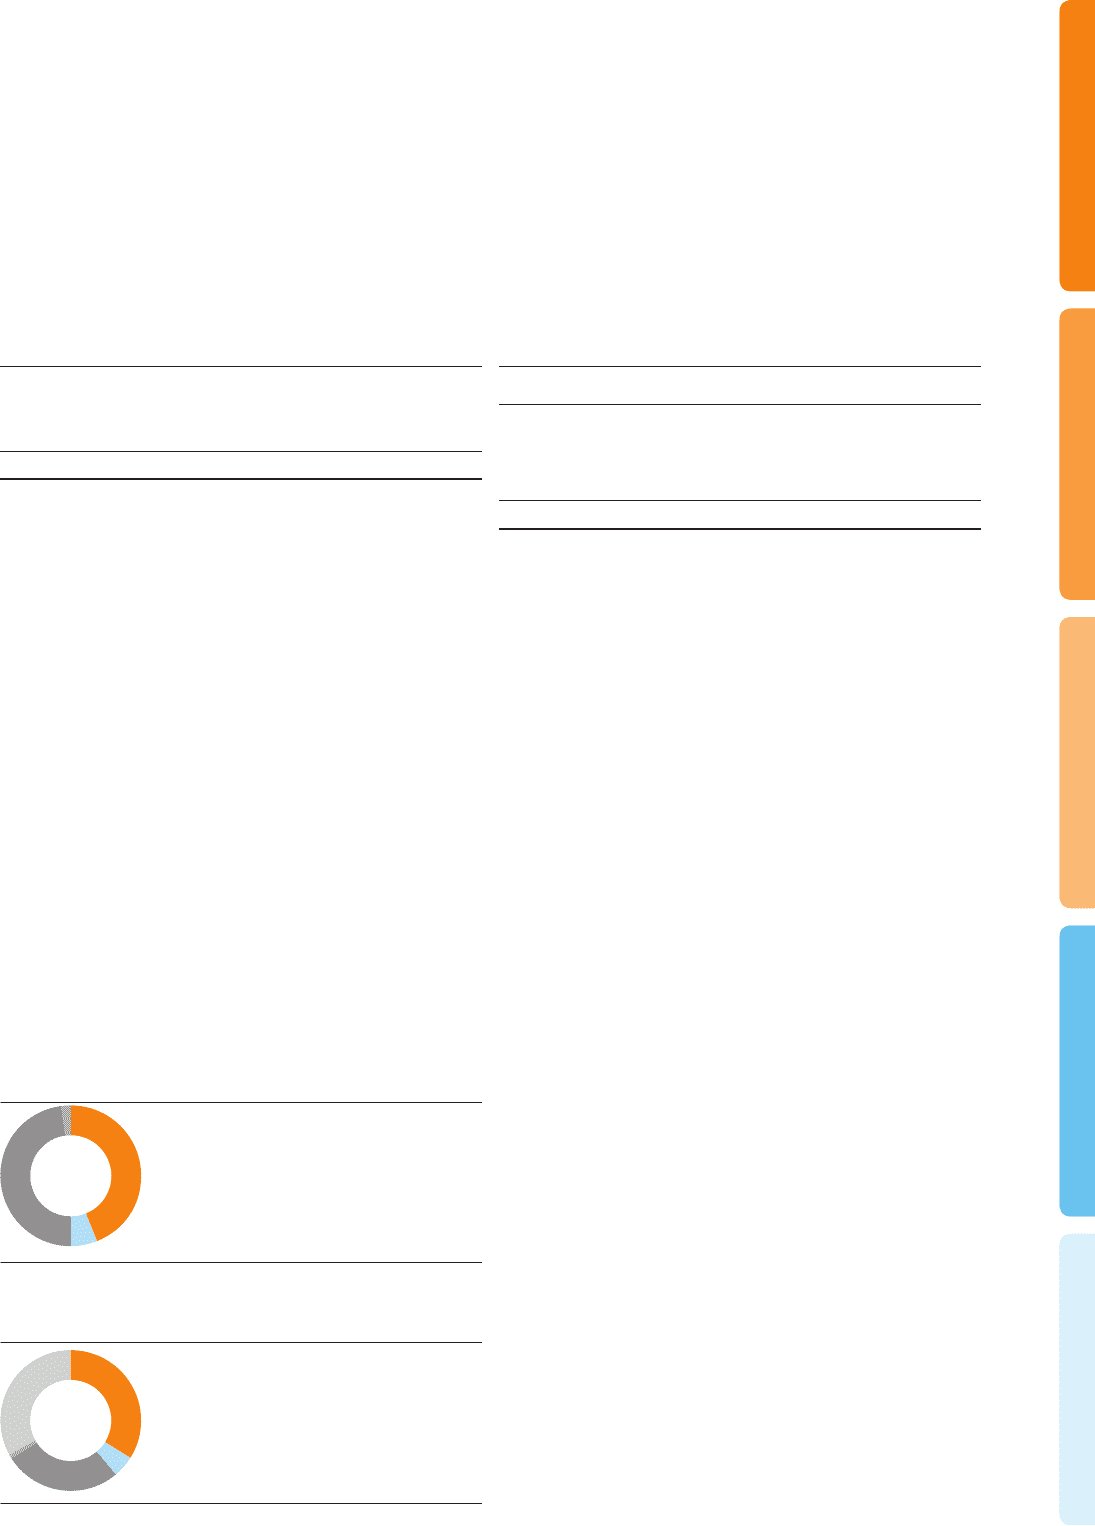
Total costs
2010 currency split
■
euro 34%
■
Swiss franc 5%
■
sterling 27%
■
other 1%
■
US dollar 33%
Overview Business review Governance Accounts Other information
19
easyJet plc
Annual report and accounts 2010