Classmates.com 2005 Annual Report Download - page 93
Download and view the complete annual report
Please find page 93 of the 2005 Classmates.com annual report below. You can navigate through the pages in the report by either clicking on the pages listed below, or by using the keyword search tool below to find specific information within the annual report.-
 1
1 -
2
-
3
-
4
-
5
-
6
-
7
-
8
-
9
-
10
-
11
-
12
-
13
-
14
-
15
-
16
-
17
-
18
-
19
-
20
-
21
-
22
-
23
-
24
-
25
-
26
-
27
-
28
-
29
-
30
-
31
-
32
-
33
-
34
-
35
-
36
-
37
-
38
-
39
-
40
-
41
-
42
-
43
-
44
-
45
-
46
-
47
-
48
-
49
-
50
-
51
-
52
-
53
-
54
-
55
-
56
-
57
-
58
-
59
-
60
-
61
-
62
-
63
-
64
-
65
-
66
-
67
-
68
-
69
-
70
-
71
-
72
-
73
-
74
-
75
-
76
-
77
-
78
-
79
-
80
-
81
-
82
-
 83
83 -
 84
84 -
 85
85 -
 86
86 -
 87
87 -
 88
88 -
 89
89 -
 90
90 -
 91
91 -
 92
92 -
 93
93 -
 94
94 -
 95
95 -
 96
96 -
 97
97 -
 98
98 -
 99
99 -
 100
100 -
 101
101 -
 102
102 -
 103
103 -
104
-
105
-
106
-
107
-
108
-
109
-
110
-
111
-
112
-
113
-
114
-
115
-
116
 |
 |
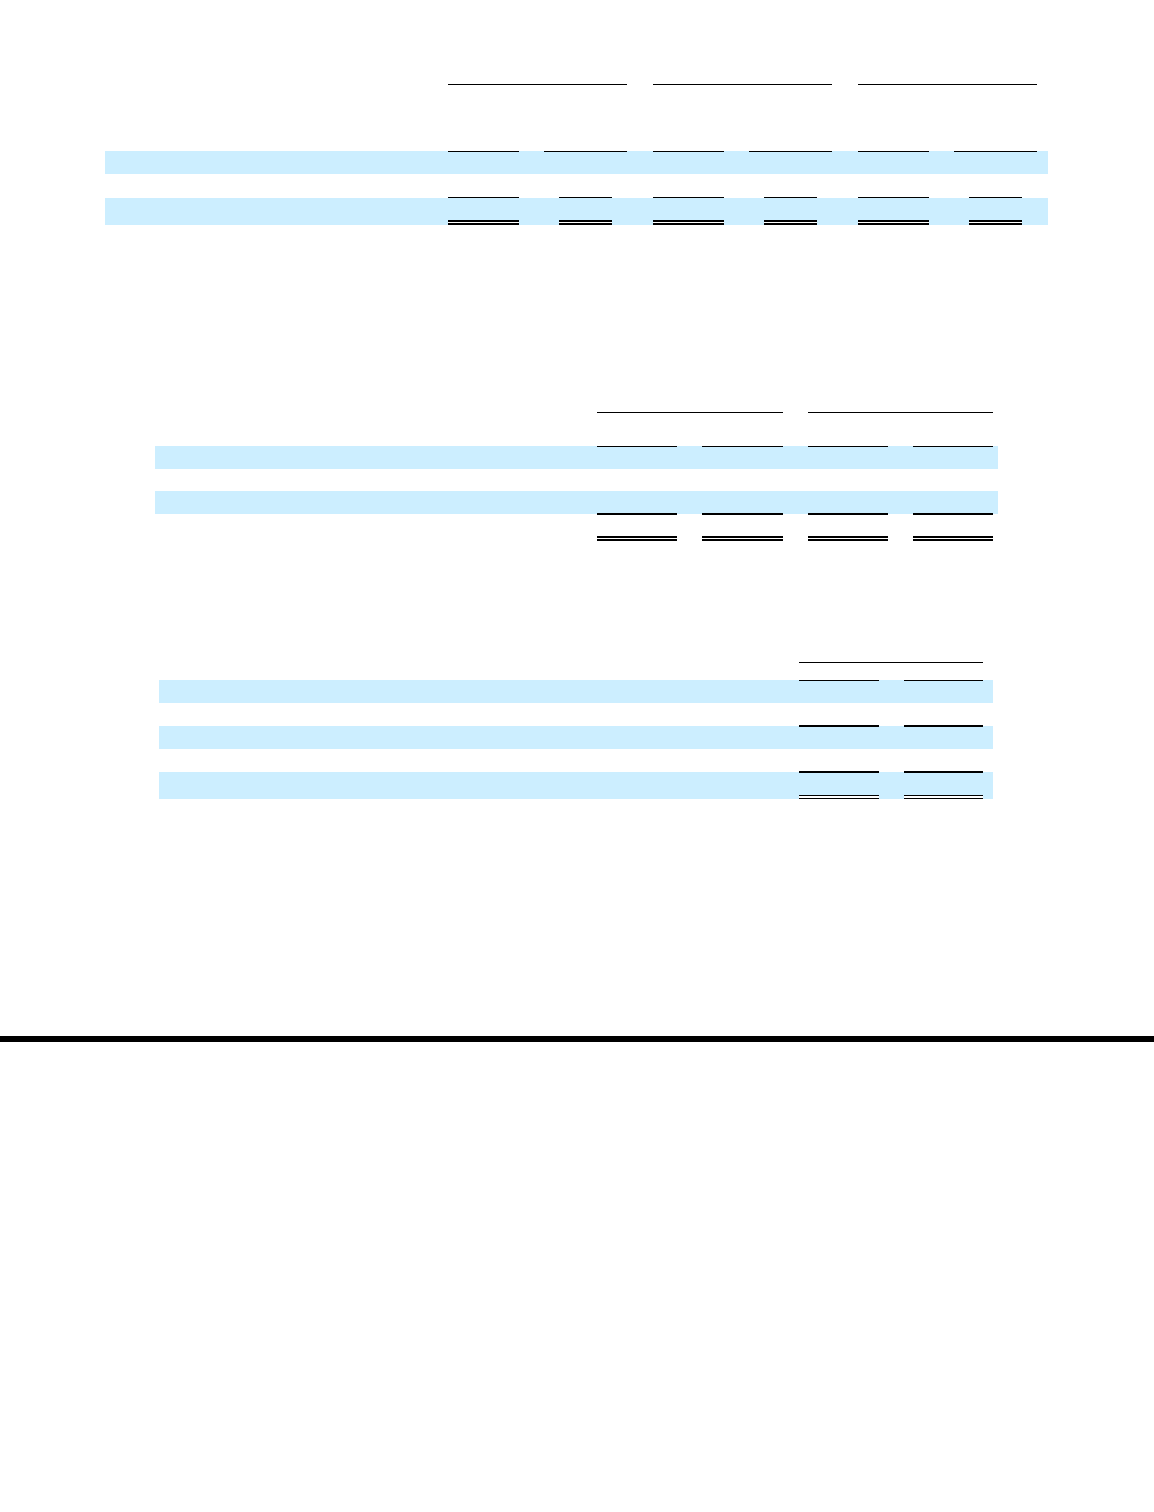
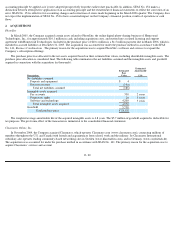
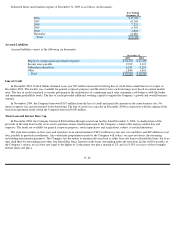
The following table summarizes the fair value and gross unrealized losses of our short-term investments, aggregated by type of investment
instrument and length of time that individual securities have been in a continuous unrealized loss position, at December 31, 2005 (in thousands):
Our investment portfolio consists of both corporate and government securities that have a maximum maturity of three years. The longer the
duration of these securities, the more susceptible they are to changes in market interest rates and bond yields. As yields increase, those securities
purchased with a lower yield-at-cost show a mark-to-market unrealized loss. All unrealized losses are due to changes in interest rates and bond
yields. We expect to realize the full value of all these investments upon maturity or sale.
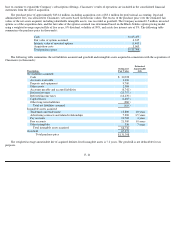
Maturities of short-term investments were as follows (in thousands):
Property and Equipment
Property and equipment consists of the following (in thousands):
Depreciation expense for the years ended December 31, 2005 and 2004, the six months ended December 31, 2003 and the year ended
June 30, 2003 was $15.5 million, $8.7 million, $3.1 million and $11.1 million, respectively. Assets under capital leases are included in computer
software and equipment. At December 31, 2005, the amount capitalized and the related accumulated depreciation were $1.3 million and $0.7
million, respectively. At December 31, 2004, the amount capitalized and the related accumulated depreciation were $1.3 million and
$0.1 million, respectively.
F- 24
Less than 12 Months
12 Months or Greater
Total
Fair
Value
Gross
Unrealized
Losses
Fair
Value
Gross
Unrealized
Losses
Fair
Value
Gross
Unrealized
Losses
U.S. corporate notes
$
26,132
$
(10
)
$
—
$
—
$
26,132
$
(10
)
Government agencies
33,990
(172
)
19,819
(320
)
53,809
(492
)
Total
$
60,122
$
(182
)
$
19,819
$
(320
)
$
79,941
$
(502
)
December 31, 2005
December 31, 2004
Amortized
Cost
Estimated
Fair Value
Amortized
Cost
Estimated
Fair Value
Maturing within 1 year
$
39,119
$
39,091
$
29,159
$
29,158
Maturing between 1 year and 4 years
39,995
39,584
62,854
62,832
Maturing after 4 years
65,350
65,290
84,292
84,291
Total
$
144,464
$
143,965
$
176,305
$
176,281
December 31,
2005
2004
Computer software and equipment
$
90,357
$
70,329
Furniture and fixtures
11,351
10,077
101,708
80,406
Less: accumulated depreciation
(68,615
)
(53,400
)
Total
$
33,093
$
27,006