Classmates.com 2005 Annual Report Download - page 40
Download and view the complete annual report
Please find page 40 of the 2005 Classmates.com annual report below. You can navigate through the pages in the report by either clicking on the pages listed below, or by using the keyword search tool below to find specific information within the annual report.-
 1
1 -
2
-
3
-
4
-
5
-
6
-
7
-
8
-
9
-
10
-
11
-
12
-
13
-
14
-
15
-
16
-
17
-
18
-
19
-
20
-
21
-
22
-
23
-
24
-
25
-
26
-
27
-
28
-
29
-
 30
30 -
 31
31 -
 32
32 -
 33
33 -
 34
34 -
 35
35 -
 36
36 -
 37
37 -
 38
38 -
 39
39 -
 40
40 -
 41
41 -
 42
42 -
 43
43 -
 44
44 -
 45
45 -
 46
46 -
 47
47 -
 48
48 -
 49
49 -
 50
50 -
51
-
52
-
53
-
54
-
55
-
56
-
57
-
58
-
59
-
60
-
61
-
62
-
63
-
64
-
65
-
66
-
67
-
68
-
69
-
70
-
71
-
72
-
73
-
74
-
75
-
76
-
77
-
78
-
79
-
80
-
81
-
82
-
83
-
84
-
85
-
86
-
87
-
88
-
89
-
90
-
91
-
92
-
93
-
94
-
95
-
96
-
97
-
98
-
99
-
100
-
101
-
102
-
103
-
104
-
105
-
106
-
107
-
108
-
109
-
110
-
111
-
112
-
113
-
114
-
115
-
116
 |
 |

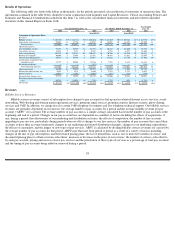
Billable services revenues increased by $55.2 million, or 13%, to $466.0 million for the year ended December 31, 2005, compared to
$410.8 million for the year ended December 31, 2004. The increase in billable services revenues was due to an increase in our average number
of pay accounts from 3,859,000 for the year ended December 31, 2004 to 4,917,000 for the year ended December 31, 2005. The increase in the
average number of pay accounts is primarily attributable to the Classmates acquisition which had approximately 1,452,000 pay accounts at the
time of acquisition and, to a lesser extent, growth in pay accounts for the Classmates’ social-networking services following the Classmates
acquisition and growth in premium email and other non-access pay accounts. The increase in the average number of pay accounts was offset
partially by a decrease in the number of pay access accounts, which resulted in a slight decrease in revenues from our pay access services. This
decrease in revenues from our pay access services was partially offset by an increase in revenues attributable to our accelerator services due to an
increase in the number of subscriptions to such services.
The increase in billable services revenues as a result of the increase in our average number of pay accounts was offset partially by a
decrease in ARPU from $8.87 for the year ended December 31, 2004 to $7.90 for the year ended December 31, 2005. The decrease in ARPU is
attributable to the increased percentage of non-access accounts as a percentage of total pay accounts since our non-access accounts generally
have a significantly lower ARPU. The decrease in ARPU is also attributable to a small decline in ARPU for our access services due to increased
use of free months of service and promotional pricing to obtain or retain pay access accounts, offset partially by an increased number of
subscriptions to our accelerator services.
For the year ended December 31, 2005, approximately 16% of our billable services revenues were attributable to non-access services as
compared to approximately 3% for the year ended December 31, 2004. We anticipate continued increases in non-access pay accounts and
decreases in pay access accounts. As a result, we anticipate that an increasing percentage of our billable services revenues will be attributable to
non-access services. However, because the ARPU for our access services is expected to continue to decline, and most of our non-access services
have a significantly lower ARPU than our access services, we anticipate a continued decrease in ARPU. Currently we do not anticipate that
growth in pay accounts, if any, will offset the revenue declines associated with declines in ARPU. As such, we anticipate declines in billable
services revenues. The December 2005 quarter was the first quarter we experienced a decline in billable services revenues.
Advertising and Commerce Revenues
Our advertising and commerce revenues consist of fees from our Internet search partners that are generated as a result of our users utilizing
our partners’ Internet search services, fees generated by our users viewing and clicking on third-party Web site advertisements and fees from
referring our users to, and our users creating pay accounts or making purchases on, sponsors’ Web sites. We also generate revenues from
providing third parties with data analysis capabilities and traditional market research services, such as surveys and questionnaires. Our
advertising and commerce revenues are generated from our active account base, including our pay accounts. Factors impacting our advertising
and commerce revenues generally include changes in orders from significant customers, the state of the online search and advertising markets,
seasonality, increases or decreases in our active accounts, limitations on our free services and increases or decreases in advertising inventory
available for sale.
Advertising and commerce revenues increased by $21.3 million, or 56%, to $59.1 million for the year ended December 31, 2005, from
$37.8 million for the year ended December 31, 2004. The increase was attributable primarily to increased advertising revenues associated with
our social-networking business and, to a lesser extent, advertising revenues generated from our Web-hosting business and our search
arrangement with Yahoo! Search. These increases were offset partially by a decrease in revenues
39