Classmates.com 2005 Annual Report Download - page 54
Download and view the complete annual report
Please find page 54 of the 2005 Classmates.com annual report below. You can navigate through the pages in the report by either clicking on the pages listed below, or by using the keyword search tool below to find specific information within the annual report.-
 1
1 -
2
-
3
-
4
-
5
-
6
-
7
-
8
-
9
-
10
-
11
-
12
-
13
-
14
-
15
-
16
-
17
-
18
-
19
-
20
-
21
-
22
-
23
-
24
-
25
-
26
-
27
-
28
-
29
-
30
-
31
-
32
-
33
-
34
-
35
-
36
-
37
-
38
-
39
-
40
-
41
-
42
-
43
-
 44
44 -
 45
45 -
 46
46 -
 47
47 -
 48
48 -
 49
49 -
 50
50 -
 51
51 -
 52
52 -
 53
53 -
 54
54 -
 55
55 -
 56
56 -
 57
57 -
 58
58 -
 59
59 -
 60
60 -
 61
61 -
 62
62 -
 63
63 -
 64
64 -
65
-
66
-
67
-
68
-
69
-
70
-
71
-
72
-
73
-
74
-
75
-
76
-
77
-
78
-
79
-
80
-
81
-
82
-
83
-
84
-
85
-
86
-
87
-
88
-
89
-
90
-
91
-
92
-
93
-
94
-
95
-
96
-
97
-
98
-
99
-
100
-
101
-
102
-
103
-
104
-
105
-
106
-
107
-
108
-
109
-
110
-
111
-
112
-
113
-
114
-
115
-
116
 |
 |
2018 and 2005, respectively. These carryforwards have been adjusted to reflect the limitations under Section 382 of the Code resulting from the
Merger.
Liquidity and Capital Resources
Our total cash, cash equivalent and short-term investment balances increased by approximately $11.6 million, or 5%, to $244.4 million at
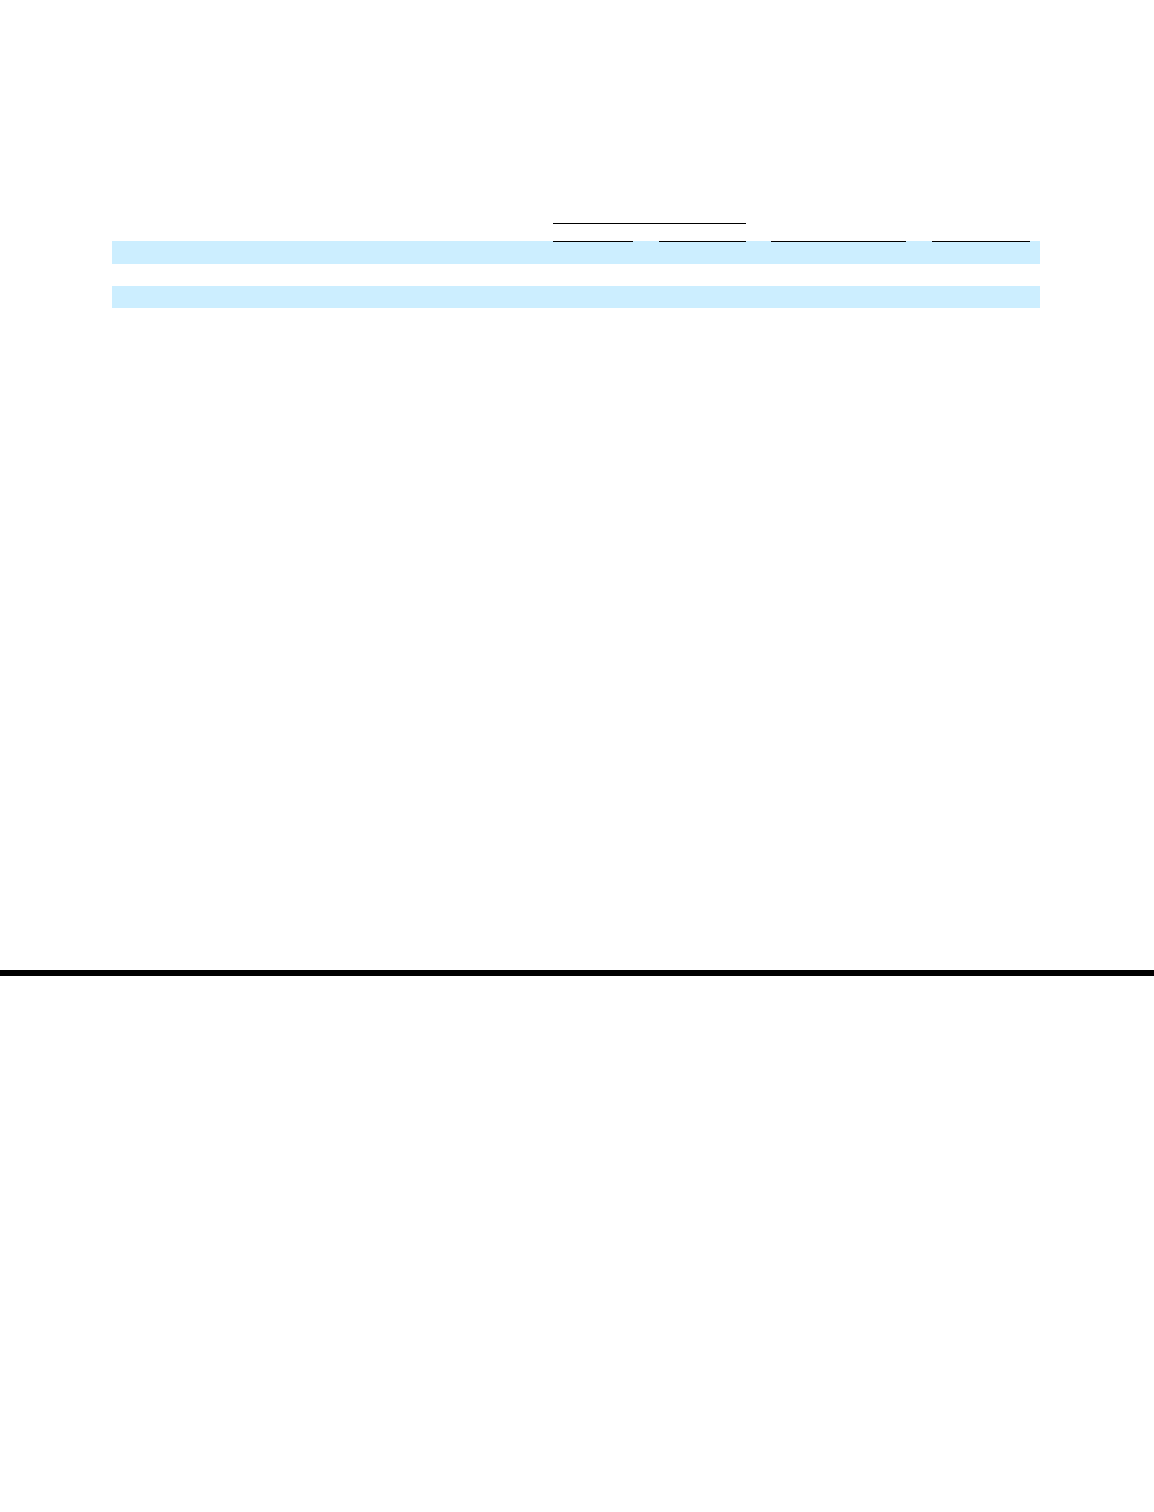
December 31, 2005 compared to $232.8 million at December 31, 2004. Our summary cash flows for the years ended December 31, 2005 and
2004, the six months ended December 31, 2003 and the year ended June 30, 2003 were as follows (in thousands):
Net cash provided by operating activities increased by $13.1 million, or 11%, for the year ended December 31, 2005 compared to the year
ended December 31, 2004. The increase is primarily the result of the following:
•
a $15.0 million net increase in working capital accounts due to increases in revenues and operating expenses and the timing of related
cash receipts and payments, including an $8.7 million increase in income taxes payable; and
•
a $15.6 million increase in depreciation, amortization and stock-based compensation in the year ended December 31, 2005 compared to
the year ended December 31, 2004 due to increases in capital expenditures and the acquisitions of Classmates and the PhotoSite business,
offset significantly by a decrease in amortization of intangible assets from the Merger.
These increases were partially offset by:
•
a $9.8 million decrease in our income tax deductions resulting from the exercise of stock options by employees. Our net operating loss
and tax credit carryforwards, when combined with exercises of employee stock options, have helped to reduce the level of cash paid for
income taxes. However, cash paid for income taxes in 2005 was $14.0 million, compared to $2.9 million in 2004, with the majority
occurring during the fourth quarter of 2005 which negatively impacted net cash provided by operating activities. We have approximately
$17 million of net operating loss carryforwards available in 2006 and $12.5 million each year from 2007 through 2020. We anticipate
that cash paid for income taxes in 2006 will be between $40 million and $45 million.
Net cash used for investing activities decreased by $104.6 million, or 97%, for the year ended December 31, 2005 compared to the year
ended December 31, 2004. The decrease is primarily the result of the following:
•
a $101.5 million decrease in cash paid for acquisitions in the year ended December 31, 2005, compared to the year ended December 31,
2004, primarily the result of the Classmates acquisition for $98.2 million in cash, net of cash acquired in November 2004; and
•
a $17.0 million increase in proceeds from maturities and sales of short-term investments, net of purchases in the year ended
December 31, 2005 compared to the year ended December 31, 2004.
53
Year Ended December 31,
Six Months Ended
December 31,
Year Ended
June 30,
2005
2004
2003
2003
Net cash provided by operating activities
$
137,047
$
123,960
$
47,892
$
65,106
Net cash used for investing activities
(3,389
)
(108,010
)
(25,886
)
(79,643
)
Net cash provided by (used for) financing activities
(89,643
)
31,654
(29,386
)
(268
)