Classmates.com 2005 Annual Report Download - page 86
Download and view the complete annual report
Please find page 86 of the 2005 Classmates.com annual report below. You can navigate through the pages in the report by either clicking on the pages listed below, or by using the keyword search tool below to find specific information within the annual report.-
 1
1 -
2
-
3
-
4
-
5
-
6
-
7
-
8
-
9
-
10
-
11
-
12
-
13
-
14
-
15
-
16
-
17
-
18
-
19
-
20
-
21
-
22
-
23
-
24
-
25
-
26
-
27
-
28
-
29
-
30
-
31
-
32
-
33
-
34
-
35
-
36
-
37
-
38
-
39
-
40
-
41
-
42
-
43
-
44
-
45
-
46
-
47
-
48
-
49
-
50
-
51
-
52
-
53
-
54
-
55
-
56
-
57
-
58
-
59
-
60
-
61
-
62
-
63
-
64
-
65
-
66
-
67
-
68
-
69
-
70
-
71
-
72
-
73
-
74
-
75
-
 76
76 -
 77
77 -
 78
78 -
 79
79 -
 80
80 -
 81
81 -
 82
82 -
 83
83 -
 84
84 -
 85
85 -
 86
86 -
 87
87 -
 88
88 -
 89
89 -
 90
90 -
 91
91 -
 92
92 -
 93
93 -
 94
94 -
 95
95 -
 96
96 -
97
-
98
-
99
-
100
-
101
-
102
-
103
-
104
-
105
-
106
-
107
-
108
-
109
-
110
-
111
-
112
-
113
-
114
-
115
-
116
 |
 |

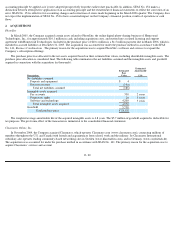
If the fair value based method had been applied in measuring stock-based compensation expense, the pro forma effect on net income and
net income per share would have been as follows (in thousands, except per share amounts):
The weighted average grant-date fair value of options granted was $7.08, $13.75, $16.29 and $13.04 per share for the years ended
December 31, 2005 and 2004, the six months ended December 31, 2003 and the year ended June 30, 2003, respectively.
During the year ended December 31, 2005, the Company issued 1.7 million restricted stock units (“RSUs”) with a weighted average grant-
date fair value of $10.77. During the year ended December 31, 2004, the Company issued 0.6 million shares of restricted stock with a weighted
average grant-date fair value of $19.91.
Comprehensive Income— SFAS No. 130, Reporting Comprehensive Income,
establishes standards for reporting comprehensive income and
its components in financial statements. Comprehensive income, as defined, includes all changes in equity (net assets) during a period from non-
owner sources. For the Company, comprehensive income consists of its reported net income, the net unrealized gains or losses on short-term
investments and derivatives and foreign currency translation.
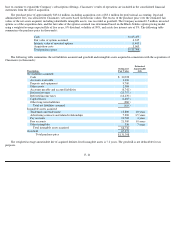
Debt Issuance Costs— Debt issuance costs are amortized over the duration of the related term loan using the effective interest method. The
Company capitalized debt issuance costs totaling $0.1 million and $1.7 million during the years ended December 31, 2005 and 2004. At
December 31, 2005, debt issuance costs of $1.5 million were included in other current assets and other assets. During the years ended
December 31, 2005 and 2004, the Company amortized $1.2 million and $28,000 of debt issuance costs, respectively.
Foreign Currency— The functional currency of the Company’s international subsidiaries is the local currency. The financial statements of
these subsidiaries are translated to U.S. dollars using period-
end rates of exchange for assets and liabilities, and average rates of exchange for the
period for revenues and expenses. Translation gains and losses are recorded in accumulated other comprehensive income as a component of
stockholders’ equity. Net gains and losses resulting from foreign exchange transactions were not significant during the periods presented.
F- 17
Year Ended
December 31,
Six Months
Ended
December 31,
Year Ended
June 30,
2005
2004
2003
2003
Net income, as reported
$
47,127
$
117,480
$
33,327
$
27,792
Add: Stock
-
based compensation included in net income,
net of tax
8,264
2,449
—
107
Deduct: Total stock-based compensation determined
under fair value
-
based method for all awards, net of tax
(23,360
)
(12,712
)
(12,510
)
(21,600
)
Pro forma net income
$
32,031
$
107,217
$
20,817
$
6,299
Net income per share
—basic, as reported
$
0.77
$
1.91
$
0.52
$
0.45
Net income per share
—
basic, pro forma
$
0.52
$
1.75
$
0.32
$
0.10
Net income per share
—
diluted, as reported
$
0.74
$
1.81
$
0.48
$
0.41
Net income per share
—
diluted, pro forma
$
0.50
$
1.64
$
0.30
$
0.09