Classmates.com 2005 Annual Report Download - page 39
Download and view the complete annual report
Please find page 39 of the 2005 Classmates.com annual report below. You can navigate through the pages in the report by either clicking on the pages listed below, or by using the keyword search tool below to find specific information within the annual report.-
 1
1 -
2
-
3
-
4
-
5
-
6
-
7
-
8
-
9
-
10
-
11
-
12
-
13
-
14
-
15
-
16
-
17
-
18
-
19
-
20
-
21
-
22
-
23
-
24
-
25
-
26
-
27
-
28
-
 29
29 -
 30
30 -
 31
31 -
 32
32 -
 33
33 -
 34
34 -
 35
35 -
 36
36 -
 37
37 -
 38
38 -
 39
39 -
 40
40 -
 41
41 -
 42
42 -
 43
43 -
 44
44 -
 45
45 -
 46
46 -
 47
47 -
 48
48 -
 49
49 -
50
-
51
-
52
-
53
-
54
-
55
-
56
-
57
-
58
-
59
-
60
-
61
-
62
-
63
-
64
-
65
-
66
-
67
-
68
-
69
-
70
-
71
-
72
-
73
-
74
-
75
-
76
-
77
-
78
-
79
-
80
-
81
-
82
-
83
-
84
-
85
-
86
-
87
-
88
-
89
-
90
-
91
-
92
-
93
-
94
-
95
-
96
-
97
-
98
-
99
-
100
-
101
-
102
-
103
-
104
-
105
-
106
-
107
-
108
-
109
-
110
-
111
-
112
-
113
-
114
-
115
-
116
 |
 |

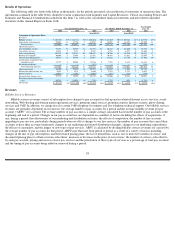
Results of Operations
The following table sets forth (with dollars in thousands), for the periods presented, selected historical statements of operations data. The
information contained in the table below should be read in conjunction with Liquidity and Capital Resources, Critical Accounting Policies and
Estimates and Financial Commitments included in this Item 7 as well as the consolidated financial statements and notes thereto included
elsewhere in this Annual Report on Form 10-K.
Revenues
Billable Services Revenues
Billable services revenues consist of subscription fees charged to pay accounts for dial-up and accelerated Internet access services, social-
networking, Web-hosting and domain name registration services, premium email services, premium content, Internet security, photo-sharing
services and VoIP. In addition, we charge fees for certain VoIP telephony for minutes and live telephone technical support. Our billable services
revenues are primarily dependent on two factors: the average number of pay accounts for a period and the average monthly revenue per pay
account (“ARPU”) for a period. The average number of pay accounts is a simple average calculated based on the number of pay accounts at the
beginning and end of a period. Changes in our pay account base are dependent on a number of factors including the effects of acquisitions, if
any, during a period; the effectiveness of our marketing and distribution activities; the effects of competition; the number of free accounts
upgrading to pay services, particularly during periods when we effect changes to our free services; the number of pay accounts that cancel their
accounts or have their accounts terminated; changes in our marketing and related distribution channels; changes in our marketing expenditures;
the effects of seasonality; and the impact of new types of pay services. ARPU is calculated by dividing billable services revenues for a period by
the average number of pay accounts for that period. ARPU may fluctuate from period to period as a result of a variety of factors including
changes in the mix of pay subscriptions and their related pricing plans; the use of promotions, such as one or more free months of service, and
discounted pricing plans to obtain or retain subscribers; increases or decreases in the price of our services; the number of services subscribed to
by each pay account; pricing and success of new pay services and the penetration of these types of services as a percentage of total pay accounts;
and the timing of pay accounts being added or removed during a period.
38
Year Ended December, 31,
Six Months Ended December 31,
Year Ended
June 30,
2005
2004
2003
2003
2002
2003
(unaudited)
(unaudited)
Statements of Operations Data:
Revenues:
Billable services
$
465,980
89
%
$
410,821
92
%
$
306,086
90
%
$
167,639
90
%
$
109,343
88
%
$
247,790
89
%
Advertising and commerce
59,081
11
37,796
8
33,079
10
18,099
10
14,525
12
29,505
11
Total revenues
525,061
100
448,617
100
339,165
100
185,738
100
123,868
100
277,295
100
Operating expenses:
Cost of billable services
98,157
19
94,999
21
92,785
27
46,182
25
42,690
34
89,293
32
Cost of free services
12,515
2
7,393
2
9,659
3
3,953
2
6,897
6
12,603
5
Sales and marketing
209,292
40
178,981
40
120,619
36
70,526
38
36,530
30
86,623
31
Product development
40,009
8
27,454
6
21,881
6
10,488
6
11,661
9
23,054
8
General and administrative
56,729
11
39,894
9
29,087
9
14,022
7
12,740
10
27,805
10
Amortization of goodwill and
intangible assets
21,799
4
20,403
5
15,856
5
7,928
4
8,483
7
16,411
6
Restructuring charges
—
—
—
—
(
215
)
—
—
—
—
—
(
215
)
—
Total operating expenses
438,501
84
369,124
82
289,672
85
153,099
82
119,001
96
255,574
92
Operating income
86,560
16
79,493
18
49,493
15
32,639
18
4,867
4
21,721
8
Interest and other income, net
6,885
1
5,138
1
5,640
2
2,994
2
2,379
2
5,025
2
Interest expense
(6,073
)
(1
)
(1,202
)
—
(
1,004
)
—
(
587
)
—
(
318
)
—
(
735
)
—
Income before income taxes
87,372
17
83,429
19
54,129
16
35,046
19
6,928
6
26,011
9
Provision (benefit) for income
taxes
40,245
8
(34,051
)
(8
)
(754
)
—
1,719
1
692
1
(1,781
)
(1
)
Net income
$
47,127
9
%
$
117,480
26
%
$
54,883
16
%
$
33,327
18
%
$
6,236
5
%
$
27,792
10
%