Classmates.com 2005 Annual Report Download - page 42
Download and view the complete annual report
Please find page 42 of the 2005 Classmates.com annual report below. You can navigate through the pages in the report by either clicking on the pages listed below, or by using the keyword search tool below to find specific information within the annual report.-
 1
1 -
2
-
3
-
4
-
5
-
6
-
7
-
8
-
9
-
10
-
11
-
12
-
13
-
14
-
15
-
16
-
17
-
18
-
19
-
20
-
21
-
22
-
23
-
24
-
25
-
26
-
27
-
28
-
29
-
30
-
31
-
 32
32 -
 33
33 -
 34
34 -
 35
35 -
 36
36 -
 37
37 -
 38
38 -
 39
39 -
 40
40 -
 41
41 -
 42
42 -
 43
43 -
 44
44 -
 45
45 -
 46
46 -
 47
47 -
 48
48 -
 49
49 -
 50
50 -
 51
51 -
 52
52 -
53
-
54
-
55
-
56
-
57
-
58
-
59
-
60
-
61
-
62
-
63
-
64
-
65
-
66
-
67
-
68
-
69
-
70
-
71
-
72
-
73
-
74
-
75
-
76
-
77
-
78
-
79
-
80
-
81
-
82
-
83
-
84
-
85
-
86
-
87
-
88
-
89
-
90
-
91
-
92
-
93
-
94
-
95
-
96
-
97
-
98
-
99
-
100
-
101
-
102
-
103
-
104
-
105
-
106
-
107
-
108
-
109
-
110
-
111
-
112
-
113
-
114
-
115
-
116
 |
 |

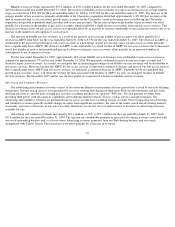
Our cost of billable services as a percentage of billable services revenues is highly dependent on the pricing for our services, our average
hourly telecommunications cost and usage, and our average customer billing and support costs per pay account. If we are not successful in the
percentage of our pay access accounts subscribing to our accelerated access services, or increasing the percentage of our pay account base
subscribing to higher margin services including our social-networking services, or if due to competitive or other factors we decrease the pricing
for our access or other services or increase the use of promotions such as one or more free months of service, or if our new pay services are less
profitable than our existing pay services, it is likely that our cost of billable services as a percentage of billable services revenues would be
adversely impacted. In particular, we anticipate that our VoIP service will be less profitable than our existing pay services and have launched our
pay VoIP services offering three months of free service which will negatively impact our cost of billable services as a percentage of revenues.
While our average hourly telecommunications costs have decreased consistently for some time, we experienced slightly higher hourly
telecommunications costs in the June 2005 quarter versus the March 2005 quarter due to less efficient port utilization associated with a decrease
in total telecommunications hours utilized by our pay access account base. The decrease in total hours utilized was attributable to lower average
monthly usage per pay access account and a decrease in pay access accounts. We may experience increased average hourly telecommunications
costs in future periods, particularly if these trends continue or if we expand our service coverage to additional geographic areas where
telecommunications costs are higher. Additionally, while the average hourly usage of our pay access accounts decreased in the year ended
December 31, 2005 compared to the year ended December 31, 2004, we may experience increased average hourly usage in future periods when
compared to the comparable period of the prior year, which would adversely impact this percentage.
Cost of Free Services
Cost of free services includes direct costs and costs that have been allocated to free services. Allocated costs consist primarily of
telecommunications and data center costs, personnel and overhead-related costs associated with operating our network and data centers,
depreciation of network computers and equipment and email technical support. We allocate costs associated with access services between
billable services and free services based on the aggregate hourly usage of our free access accounts as a percentage of total hours used by our
active access accounts. We allocate costs associated with Web hosting and online photos between billable services and free services based on
estimated bandwidth used by free Web-hosting and online photo accounts. Costs associated with our social-networking services are allocated
between billable services and free services based on the number of Web site visits by free accounts relative to the total number of user visits.
Cost of free services increased by $5.1 million, or 69%, to $12.5 million for the year ended December 31, 2005, compared to $7.4 million
for the year ended December 31, 2004. The increase was due primarily to increased costs associated with our social-networking business since
the acquisition. The increases include a $4.3 million increase in personnel and overhead-
related costs and a $1.7 million increase in depreciation.
The increases were partially offset by a $0.8 million decrease in telecommunications costs. The decrease in telecommunications costs was a
result of a decrease in average hourly telecommunications costs, a decrease in the number of active free access accounts and a slight decrease in
the average hourly usage of these accounts. The decrease in free active access accounts resulted from free accounts upgrading to our pay
services, fewer new free account sign-ups and additional accounts becoming inactive. Telecommunications hours allocated to our free access
accounts decreased to approximately 3% of total telecommunications hours purchased during the year ended December 31, 2005, compared to
approximately 6% during the year ended December 31, 2004. Cost of free services could increase as a percentage of revenues in 2006 as a result
of a number of factors, including increased compensation expense recognized in connection with the adoption of SFAS No. 123R, commencing
in the March 2006 quarter.
41