Classmates.com 2005 Annual Report Download - page 41
Download and view the complete annual report
Please find page 41 of the 2005 Classmates.com annual report below. You can navigate through the pages in the report by either clicking on the pages listed below, or by using the keyword search tool below to find specific information within the annual report.-
 1
1 -
2
-
3
-
4
-
5
-
6
-
7
-
8
-
9
-
10
-
11
-
12
-
13
-
14
-
15
-
16
-
17
-
18
-
19
-
20
-
21
-
22
-
23
-
24
-
25
-
26
-
27
-
28
-
29
-
30
-
 31
31 -
 32
32 -
 33
33 -
 34
34 -
 35
35 -
 36
36 -
 37
37 -
 38
38 -
 39
39 -
 40
40 -
 41
41 -
 42
42 -
 43
43 -
 44
44 -
 45
45 -
 46
46 -
 47
47 -
 48
48 -
 49
49 -
 50
50 -
 51
51 -
52
-
53
-
54
-
55
-
56
-
57
-
58
-
59
-
60
-
61
-
62
-
63
-
64
-
65
-
66
-
67
-
68
-
69
-
70
-
71
-
72
-
73
-
74
-
75
-
76
-
77
-
78
-
79
-
80
-
81
-
82
-
83
-
84
-
85
-
86
-
87
-
88
-
89
-
90
-
91
-
92
-
93
-
94
-
95
-
96
-
97
-
98
-
99
-
100
-
101
-
102
-
103
-
104
-
105
-
106
-
107
-
108
-
109
-
110
-
111
-
112
-
113
-
114
-
115
-
116
 |
 |

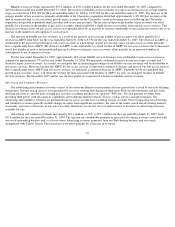
generated from our expired agreement with General Motors Corporation (“GM”), from which we derived approximately 6% of our advertising
and commerce revenues for the year ended December 31, 2004.
For the year ended December 31, 2005, 43% of advertising and commerce revenues were attributable to our non-access services, which
compares to 11% for the year ended December 31, 2004. We anticipate that an increasing percentage of our advertising and commerce revenues
will be attributable to our non-access services.
Cost of Billable Services
Cost of billable services includes direct costs of billable services and costs that have been allocated to billable services. Direct costs consist
of costs related to providing telephone technical support, customer billing and billing support to our pay accounts, domain name registration fees
and costs associated with our VoIP telephony service, which include telecommunications costs and costs for license fees, customer support and
depreciation. Allocated costs consist primarily of telecommunications and data center costs, personnel and overhead-related costs associated
with operating our networks and data centers, depreciation of network computers and equipment, email technical support and license fees. We
allocate costs associated with access services between billable services and free services based on the aggregate hourly usage of our pay access
accounts as a percentage of total hours used by our active access accounts. We allocate costs associated with Web hosting and online photos
between billable services and free services based on estimated bandwidth used by pay Web-hosting and online photo accounts relative to
estimated bandwidth used by free Web-hosting and online photo accounts. Costs associated with our social-networking services are allocated
between billable services and free services based on the number of Web site visits by pay accounts relative to the total number of visits. Costs
associated with our VoIP telephony service are all allocated to cost of billable services.
Cost of billable services increased by $3.2 million, or 3%, to $98.2 million for the year ended December 31, 2005, compared to $95.0
million for the year ended December 31, 2004. The increase was primarily due to our social-networking business and $1.2 million in costs
associated with our VoIP telephony service, including a $3.7 million increase in network personnel and overhead-related costs, a $1.8 million
increase in customer support and billing-related costs as a result of an increase in the number of pay accounts, and a $1.6 million increase in
network depreciation allocated to billable services. These increases were partially offset by a $4.1 million decrease in telecommunications costs.
Telecommunications costs decreased as a result of a decrease in the average monthly usage per pay access account and a slight decrease in
average hourly telecommunications costs. Telecommunications hours allocated to our pay access account base increased to approximately 97%
of total telecommunications hours purchased during the year ended December 31, 2005, compared to approximately 94% during the year ended
December 31, 2004.
Cost of billable services as a percentage of billable services revenues decreased by 2% to 21.1% in the year ended December 31, 2005,
compared to 23.1% in the year ended December 31, 2004. The decrease resulted primarily from lower costs as a percentage of revenues
associated with our pay social-networking and Web-hosting services relative to our pay access services, and lower costs as a percentage of
revenues associated with our pay access services due primarily to a decrease in average hourly telecommunications costs and average hourly
usage per pay access account. However, cost of billable services as a percentage of billable services revenues increased to 20.7% and 21.9%
during the September 2005 and December 2005 quarters, respectively, due primarily to decreases in ARPU for our access services and increased
costs associated with our VoIP telephony service. We currently anticipate that cost of billable services as a percentage of billable services
revenues will continue to increase due to a number of factors, including, increased compensation expense recognized in connection with the
adoption of Statement of Financial Accounting Standards (“SFAS”) No. 123R, Share-Based Payment , commencing in the March 2006 quarter.
40