Classmates.com 2005 Annual Report Download - page 48
Download and view the complete annual report
Please find page 48 of the 2005 Classmates.com annual report below. You can navigate through the pages in the report by either clicking on the pages listed below, or by using the keyword search tool below to find specific information within the annual report.-
 1
1 -
2
-
3
-
4
-
5
-
6
-
7
-
8
-
9
-
10
-
11
-
12
-
13
-
14
-
15
-
16
-
17
-
18
-
19
-
20
-
21
-
22
-
23
-
24
-
25
-
26
-
27
-
28
-
29
-
30
-
31
-
32
-
33
-
34
-
35
-
36
-
37
-
 38
38 -
 39
39 -
 40
40 -
 41
41 -
 42
42 -
 43
43 -
 44
44 -
 45
45 -
 46
46 -
 47
47 -
 48
48 -
 49
49 -
 50
50 -
 51
51 -
 52
52 -
 53
53 -
 54
54 -
 55
55 -
 56
56 -
 57
57 -
 58
58 -
59
-
60
-
61
-
62
-
63
-
64
-
65
-
66
-
67
-
68
-
69
-
70
-
71
-
72
-
73
-
74
-
75
-
76
-
77
-
78
-
79
-
80
-
81
-
82
-
83
-
84
-
85
-
86
-
87
-
88
-
89
-
90
-
91
-
92
-
93
-
94
-
95
-
96
-
97
-
98
-
99
-
100
-
101
-
102
-
103
-
104
-
105
-
106
-
107
-
108
-
109
-
110
-
111
-
112
-
113
-
114
-
115
-
116
 |
 |

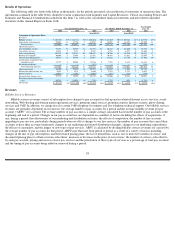
due to a $4.2 million increase in customer support and billing-related costs as a result of an increase in the number of pay accounts, a
$1.3 million increase in network personnel and overhead-related costs allocated to billable services and a $0.5 million increase in network
depreciation allocated to billable services. These costs were offset partially by a $3.8 million decrease in telecommunications costs.
Telecommunications costs decreased as a result of a decrease in the average monthly usage per pay access account and a decrease in average
hourly telecommunications costs, offset partially by an increase in the number of pay access accounts. Our average hourly telecommunications
costs decreased as a result of better port utilization, improvements made in allocating our telecommunications usage to our lower cost vendors
and lower telecommunications prices. Telecommunications hours allocated to our pay access account base increased to approximately 94% of
total telecommunications hours purchased during the year ended December 31, 2004, compared to approximately 88% during the year ended
December 31, 2003.
Cost of billable services as a percentage of billable services revenues was 23.1% in the year ended December 31, 2004, compared to 30.3%
in the year ended December 31, 2003. The decrease resulted from a decrease in average hourly telecommunications costs per pay access account;
decreased customer billing and support costs per pay account primarily as a result of better pricing obtained from our principal customer support
vendor; and a decrease in average hourly usage per pay access account.
Cost of Free Services
Cost of free services decreased by $2.3 million, or 23%, to $7.4 million for the year ended December 31, 2004, compared to $9.7 million
for the year ended December 31, 2003. The decrease was due primarily to a $2.5 million decrease in telecommunications costs. The decrease in
telecommunications costs was a result of a decrease in average hourly telecommunications costs, a decrease in the number of active free access
accounts and a decrease in the average hourly usage of these accounts. The decrease in free access accounts resulted from free accounts
upgrading to our pay services and fewer new free account sign-
ups. Telecommunications hours allocated to our free access accounts decreased to
approximately 6% of total telecommunications hours purchased during the year ended December 31, 2004, compared to approximately 12%
during the year ended December 31, 2003. The decrease in cost of free services was partially offset by a $0.2 million increase in personnel and
overhead-related costs.
Sales and Marketing
Sales and marketing expenses increased by $58.4 million, or 48%, to $179.0 million for the year ended December 31, 2004, compared to
$120.6 million for the year ended December 31, 2003. Sales and marketing was approximately 40% of revenues for the year ended
December 31, 2004, compared to approximately 36% of revenues for the year ended December 31, 2003. The increase was primarily attributable
to a $48.7 million increase in marketing, promotion and distribution costs. Additionally, sales and marketing expenses increased as a result of an
$8.2 million increase in telemarketing expenses related to customer acquisition, retention and up-sell activities and a $1.2 million increase in
personnel-related expenses.
Product Development
Product development expenses increased by $5.6 million, or 25%, to $27.5 million for the year ended December 31, 2004, compared to
$21.9 million for the year ended December 31, 2003. The increase was primarily the result of a $6.4 million increase in personnel-related
expenses as a result of increased headcount and compensation costs, including increased costs associated with our acquisitions of our Web-
hosting and community-
based networking businesses, partially offset by a $0.8 million decrease in depreciation. Depreciation expense decreased
as a result of assets placed in service in prior years becoming fully depreciated and lower levels of capital expenditures in recent years versus
prior years.
47