Classmates.com 2005 Annual Report Download - page 74
Download and view the complete annual report
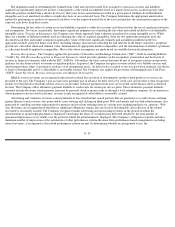
Please find page 74 of the 2005 Classmates.com annual report below. You can navigate through the pages in the report by either clicking on the pages listed below, or by using the keyword search tool below to find specific information within the annual report.
UNITED ONLINE, INC.
CONSOLIDATED STATEMENTS OF OPERATIONS
(in thousands, except per share amounts)
The accompanying notes are an integral part of these consolidated financial statements.
F- 5
Year Ended December 31,
Six Months Ended
December 31,
Year Ended
June 30,
2005
2004
2003
2003
Revenues:
Billable services
$
465,980
$
410,821
$
167,639
$
247,790
Advertising and commerce
59,081
37,796
18,099
29,505
Total revenues
525,061
448,617
185,738
277,295
Operating expenses:
Cost of billable services (including stock-
based compensation, see Note 8)
98,157
94,999
46,182
89,293
Cost of free services
12,515
7,393
3,953
12,603
Sales and marketing (including stock-based
compensation, see Note 8)
209,292
178,981
70,526
86,623
Product development (including stock-based
compensation, see Note 8)
40,009
27,454
10,488
23,054
General and administrative (including stock
-
based
compensation, see Note 8)
56,729
39,894
14,022
27,805
Amortization of intangible assets
21,799
20,403
7,928
16,411
Restructuring charges
—
—
—
(
215
)
Total operating expenses
438,501
369,124
153,099
255,574
Operating income
86,560
79,493
32,639
21,721
Interest and other income, net
6,885
5,138
2,994
5,025
Interest expense
(6,073
)
(1,202
)
(587
)
(735
)
Income before income taxes
87,372
83,429
35,046
26,011
Provision (benefit) for income taxes
40,245
(34,051
)
1,719
(1,781
)
Net income
$
47,127
$
117,480
$
33,327
$
27,792
Net income per share
—basic
$
0.77
$
1.91
$
0.52
$
0.45
Net income per share
—diluted
$
0.74
$
1.81
$
0.48
$
0.41
Shares used to calculate basic net income per share
61,135
61,404
64,163
61,688
Shares used to calculate diluted net income per share
63,815
65,012
69,504
67,074


