Classmates.com 2005 Annual Report Download - page 109
Download and view the complete annual report
Please find page 109 of the 2005 Classmates.com annual report below. You can navigate through the pages in the report by either clicking on the pages listed below, or by using the keyword search tool below to find specific information within the annual report.-
 1
1 -
2
-
3
-
4
-
5
-
6
-
7
-
8
-
9
-
10
-
11
-
12
-
13
-
14
-
15
-
16
-
17
-
18
-
19
-
20
-
21
-
22
-
23
-
24
-
25
-
26
-
27
-
28
-
29
-
30
-
31
-
32
-
33
-
34
-
35
-
36
-
37
-
38
-
39
-
40
-
41
-
42
-
43
-
44
-
45
-
46
-
47
-
48
-
49
-
50
-
51
-
52
-
53
-
54
-
55
-
56
-
57
-
58
-
59
-
60
-
61
-
62
-
63
-
64
-
65
-
66
-
67
-
68
-
69
-
70
-
71
-
72
-
73
-
74
-
75
-
76
-
77
-
78
-
79
-
80
-
81
-
82
-
83
-
84
-
85
-
86
-
87
-
88
-
89
-
90
-
91
-
92
-
93
-
94
-
95
-
96
-
97
-
98
-
 99
99 -
 100
100 -
 101
101 -
 102
102 -
 103
103 -
 104
104 -
 105
105 -
 106
106 -
 107
107 -
 108
108 -
 109
109 -
 110
110 -
 111
111 -
 112
112 -
 113
113 -
 114
114 -
 115
115 -
 116
116
 |
 |

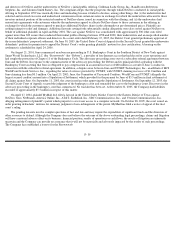
matter discussed above and such reserve is reflected in the consolidated financial statements, though the Company can provide no assurance that
such reserves will be adequate.
The Company is subject to various other legal proceedings and claims that arise in the ordinary course of business. Management believes
the amount and ultimate liability, if any, with respect to these actions will not materially affect the Company’s business, financial position,
results of operations or cash flows. There can be no assurance, however, that such actions will not be material or adversely affect the Company’s
business, financial position, results of operations or cash flows.
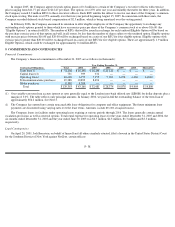
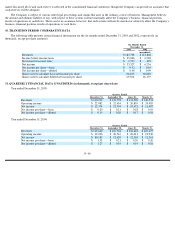
10. TRANSITION PERIOD COMPARATIVE DATA
The following table presents certain financial information for the six months ended December 31, 2003 and 2002, respectively (in
thousands, except per share amounts):
11. QUARTERLY FINANCIAL DATA (UNAUDITED) (in thousands, except per share data)
Year ended December 31, 2005:
Year ended December 31, 2004:
F- 40
Six Months Ended
December 31,
2003
2002
(unaudited)
Revenues
$
185,738
$
123,868
Income before income taxes
$
35,046
$
6,928
Provision for income taxes
$
1,719
$
692
Net income
$
33,327
$
6,236
Net income per share
—
basic
$
0.52
$
0.10
Net income per share
—
diluted
$
0.48
$
0.09
Shares used to calculate basic net income per share
64,163
60,830
Shares used to calculate diluted net income per share
69,504
66,179
Quarter Ended
December 31,
September 30,
June 30,
March 31,
Revenues
$
130,232
$
132,778
$
131,520
$
130,531
Operating income
$
22,082
$
22,634
$
20,859
$
20,985
Net income
$
12,374
$
12,594
$
10,672
$
11,487
Net income per share
—
basic
$
0.20
$
0.21
$
0.18
$
0.19
Net income per share
—
diluted
$
0.19
$
0.20
$
0.17
$
0.18
Quarter Ended
December 31,
September 30,
June 30,
March 31,
Revenues
$
119,620
$
110,704
$
110,618
$
107,675
Operating income
$
19,036
$
20,516
$
20,011
$
19,930
Net income
$
80,189
$
12,620
$
12,310
$
12,361
Net income per share
—
basic
$
1.33
$
0.21
$
0.20
$
0.20
Net income per share
—
diluted
$
1.27
$
0.19
$
0.19
$
0.18