CarMax 2008 Annual Report Download - page 61
Download and view the complete annual report
Please find page 61 of the 2008 CarMax annual report below. You can navigate through the pages in the report by either clicking on the pages listed below, or by using the keyword search tool below to find specific information within the annual report.-
 1
1 -
2
-
3
-
4
-
5
-
6
-
7
-
8
-
9
-
10
-
11
-
12
-
13
-
14
-
15
-
16
-
17
-
18
-
19
-
20
-
21
-
22
-
23
-
24
-
25
-
26
-
27
-
28
-
29
-
30
-
31
-
32
-
33
-
34
-
35
-
36
-
37
-
38
-
39
-
40
-
41
-
42
-
43
-
44
-
45
-
46
-
47
-
48
-
49
-
50
-
 51
51 -
 52
52 -
 53
53 -
 54
54 -
 55
55 -
 56
56 -
 57
57 -
 58
58 -
 59
59 -
 60
60 -
 61
61 -
 62
62 -
 63
63 -
 64
64 -
 65
65 -
 66
66 -
 67
67 -
 68
68 -
 69
69 -
 70
70 -
 71
71 -
72
-
73
-
74
-
75
-
76
-
77
-
78
-
79
-
80
-
81
-
82
-
83
-
84
-
85
 |
 |

49
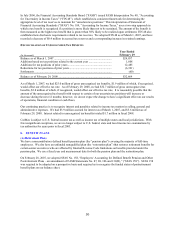
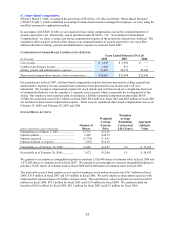
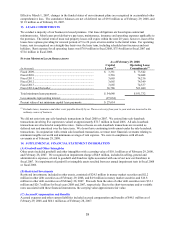
7. INCOME TAXES
PROVISION FOR INCOME TAXES
Years Ended February 29 or 28
(In thousands) 2008 2007 2006
Current:
Federal .................................................................................. $ 121,274 $ 120,250 $ 91,197
State ...................................................................................... 18,175 18,671 11,272
Total.......................................................................................... 139,449 138,921 102,469
Deferred:
Federal .................................................................................. (21,222) (13,596) (17,439)
State ...................................................................................... (3,183) (573) (1,649)
Total.......................................................................................... (24,405) (14,169) (19,088)
Provision for income taxes................................................................. $ 115,044 $ 124,752 $ 83,381
EFFECTIVE INCOME TAX RATE RECONCILIATION
Years Ended February 29 or 28
2008 2007 2006
Federal statutory income tax rate............................................... 35.0% 35.0% 35.0%
State and local income taxes, net of federal benefit................... 3.1 3.5 3.0
Nondeductible items.................................................................. 0.1 0.1 0.3
Valuation allowance .................................................................. 0.5 — —
Effective income tax rate ........................................................... 38.7% 38.6% 38.3%
TEMPORARY DIFFERENCES RESULTING IN DEFERRED TAX ASSETS AND LIABILITIES
As of February 29 or 28
(In thousands) 2008 2007
Deferred tax assets:
Accrued expenses............................................................................................... $ 28,972 $ 20,954
Partnership basis ................................................................................................ 18,394 6,138
Inventory............................................................................................................ — 2,036
Stock compensation ........................................................................................... 34,191 24,282
Capital loss carry forward.................................................................................. 1,636 —
Total gross deferred tax assets............................................................................... 83,193 53,410
Less: valuation allowance..................................................................................... (1,636) —
Net gross deferred tax assets.................................................................................. 81,557 53,410
Deferred tax liabilities:
Securitized receivables....................................................................................... 18,524 18,540
Prepaid expenses................................................................................................ 10,034 7,295
Inventory............................................................................................................ 1,677 —
Depreciation and amortization ........................................................................... 1,966 504
Other .................................................................................................................. — 29
Total gross deferred tax liabilities ......................................................................... 32,201 26,368
Net deferred tax asset ............................................................................................ $ 49,356 $ 27,042
Except for amounts for which a valuation allowance has been provided, we believe it is more likely than not that the
results of future operations will generate sufficient taxable income to realize the deferred tax assets. The valuation
allowance as of February 29, 2008, relates to a capital loss carryforward that is not more likely than not to be
utilized prior to its expiration.