CarMax 2008 Annual Report Download - page 31
Download and view the complete annual report
Please find page 31 of the 2008 CarMax annual report below. You can navigate through the pages in the report by either clicking on the pages listed below, or by using the keyword search tool below to find specific information within the annual report.-
 1
1 -
2
-
3
-
4
-
5
-
6
-
7
-
8
-
9
-
10
-
11
-
12
-
13
-
14
-
15
-
16
-
17
-
18
-
19
-
20
-
 21
21 -
 22
22 -
 23
23 -
 24
24 -
 25
25 -
 26
26 -
 27
27 -
 28
28 -
 29
29 -
 30
30 -
 31
31 -
 32
32 -
 33
33 -
 34
34 -
 35
35 -
 36
36 -
 37
37 -
 38
38 -
 39
39 -
 40
40 -
 41
41 -
42
-
43
-
44
-
45
-
46
-
47
-
48
-
49
-
50
-
51
-
52
-
53
-
54
-
55
-
56
-
57
-
58
-
59
-
60
-
61
-
62
-
63
-
64
-
65
-
66
-
67
-
68
-
69
-
70
-
71
-
72
-
73
-
74
-
75
-
76
-
77
-
78
-
79
-
80
-
81
-
82
-
83
-
84
-
85
 |
 |
19
While total gross profit per unit has gradually increased over the last several years, we believe the primary driver for
future earnings growth will be vehicle unit sales growth, from both new stores and from stores included in our
comparable store base. We target a dollar range of gross profit per used unit sold. The gross profit dollar target for
an individual vehicle is based on a variety of factors, including its anticipated probability of sale and its mileage
relative to its age; however, it is not based on the vehicle’ s selling price.
The principal challenges we face in expanding our store base include our ability to build our management bench
strength to support the store growth and our ability to procure suitable real estate at reasonable costs. We staff each
newly opened store with an experienced management team. We must therefore continually recruit, train and
develop managers and associates to fill the pipeline necessary to support future store openings. If at any time we
believed that the rate of store growth was causing our performance to falter, we would consider slowing the growth
rate.
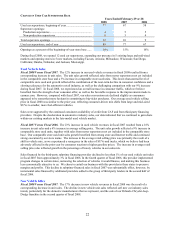
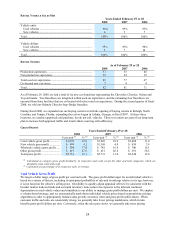
Fiscal 2008 Highlights
• We believe that difficult macro-economic conditions caused an industry-wide slowdown in sales in the
automotive retail market in fiscal 2008.
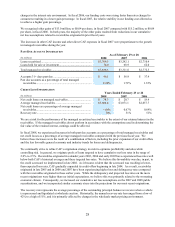
• Net sales and operating revenues increased 10% to $8.20 billion from $7.47 billion in fiscal 2007, while net
earnings decreased 8% to $182.0 million, or $0.83 per share, from $198.6 million, or $0.92 per share.
• Total used vehicle unit sales increased 12%, reflecting the combination of the growth in our store base and a 3%
increase in comparable store used unit sales. Comparable store used unit sales growth slowed from the prior
year level, reflecting the combination of the near-term decline in consumer confidence and a slowing sales pace
for the automotive retail industry, as well as the challenging comparison with our 9% increase during fiscal
2007.
• We opened 12 used car superstores in fiscal 2008, increasing our store base by 16%. The new stores included
four production superstores and eight non-production superstores, and they represented our entry into five new
markets.
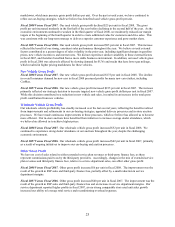
• Total wholesale vehicle unit sales increased 6%. Wholesale unit sales grew at a slower pace than our used
vehicle unit sales, reflecting a decrease in our appraisal buy rate (defined as appraisal purchases as a percent of
vehicles appraised).
• New vehicle unit sales declined 17% due to the combination of the softer new car industry trends and the sale of
a new car franchise during fiscal 2008.
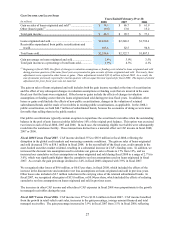
• Our total gross profit per unit remained consistent at $2,731 in both fiscal 2008 and fiscal 2007. Total gross
profit per unit increased modestly in the first half of fiscal 2008, before declining in the second half of the year
in response to the more challenging economic conditions.
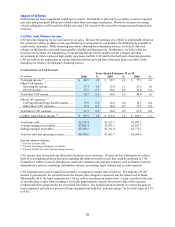
• CAF income declined 35% to $85.9 million from $132.6 million in fiscal 2007. In fiscal 2008, CAF income
was adversely affected by the disruption in the global credit markets and worsening economic conditions. As a
result, we experienced a substantial increase in CAF’ s funding costs and higher net credit losses, and we
increased the discount rate used to value our retained interest to 17% from 12%. In fiscal 2007, CAF income
included a benefit of $13.0 million, or $0.04 per share, primarily related to favorable valuation adjustments.
• Selling, general and administrative expenses as a percent of net sales and operating revenues (the “SG&A
ratio”) increased to 10.5% from 10.4% in fiscal 2007. This increase largely resulted from the modest level of
comparable store sales increase and our commitment to our ongoing growth plan, as well as the decision to
continue spending on strategic, operational and Internet initiatives in fiscal 2008.
• Net cash provided by operations decreased to $79.5 million from $136.8 million in fiscal 2007, primarily
reflecting an increased investment in working capital.
CRITICAL ACCOUNTING POLICIES
Our results of operations and financial condition as reflected in the consolidated financial statements have been
prepared in accordance with U.S. generally accepted accounting principles. Preparation of financial statements
requires management to make estimates and assumptions affecting the reported amounts of assets, liabilities,
revenues, expenses and the disclosures of contingent assets and liabilities. We use our historical experience and
other relevant factors when developing our estimates and assumptions. We continually evaluate these estimates and
assumptions. Note 2 includes a discussion of significant accounting policies. The accounting policies discussed
below are the ones we consider critical to an understanding of our consolidated financial statements because their
application places the most significant demands on our judgment. Our financial results might have been different if
different assumptions had been used or other conditions had prevailed.