CarMax 2008 Annual Report Download - page 43
Download and view the complete annual report
Please find page 43 of the 2008 CarMax annual report below. You can navigate through the pages in the report by either clicking on the pages listed below, or by using the keyword search tool below to find specific information within the annual report.31
face value of CAF subordinated bonds in the 2008-1 public securitization and the growth in the total managed
receivables. Inventories increased by 17%, or $139.7 million, in fiscal 2008, which was higher than our 10%
increase in vehicle revenues. The growth in inventories resulted from the increase in our store base and from a test
underway in fiscal 2008 to determine whether increasing onsite vehicle inventory by approximately 50 to 100 cars
per store would favorably affect sales. In the fourth quarter of fiscal 2008, this test was being conducted in
approximately 30% of our stores. We plan to continue this test in fiscal 2009.
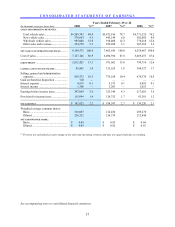
Cash generated from operating activities was $19.3 million higher in fiscal 2007 compared with fiscal 2006. The
$64.4 million increase in net earnings in fiscal 2007 was more than offset by the increased growth in inventories.
Inventories increased $166.4 million in fiscal 2007 compared with a $93.1 million increase in fiscal 2006. The
fiscal 2007 inventory increase related to store openings during fiscal 2007 and shortly after the end of the fiscal year,
as well as to added vehicle inventory required to support our strong increase in fourth quarter comparable store used
unit sales.
The aggregate principal amount of outstanding auto loan receivables funded through securitizations, which are
discussed in Notes 3 and 4, totaled $3.76 billion as of February 29, 2008; $3.24 billion as of February 28, 2007; and
$2.71 billion as of February 28, 2006. During fiscal 2008, we completed three public securitizations of auto loan
receivables, funding a total of $1.78 billion of auto loan receivables. In the 2008-1 public securitization, we held
$44.7 million face value of subordinated bonds.
As of February 29, 2008, the warehouse facility limit was $1.3 billion and unused warehouse capacity totaled $445.5
million. The warehouse facility limit was $825 million at the beginning of fiscal 2008, and it was increased to $1.0
billion at its annual renewal in July 2007 in response to the growth in our business. In December 2007, we arranged
a temporary $300 million increase in the warehouse facility capacity to $1.3 billion through April 2008, in order to
provide additional funding flexibility. The warehouse facility matures in July 2008, and we anticipate that we will
be able to renew, expand or enter into new securitizations or other funding arrangements to meet CAF’ s future
funding needs. Note 4 includes additional discussion of the warehouse facility.
Investing Activities. Net cash used in investing activities was $257.0 million in fiscal 2008, $187.2 million in fiscal
2007 and $116.1 million in fiscal 2006. Capital expenditures were $253.1 million in fiscal 2008, $191.8 million in
fiscal 2007 and $194.4 million in fiscal 2006. In addition to store construction costs, capital expenditures for all
three years included the cost of land acquired for future year store openings. In fiscal 2006, capital expenditures
also included costs associated with our new home office, which was completed in October 2005.
Historically, capital expenditures have been funded with internally generated funds, short- and long-term debt and
sale-leaseback transactions. Net proceeds from the sales of assets totaled $1.1 million in fiscal 2008, $4.6 million in
fiscal 2007 and $78.3 million in fiscal 2006. The majority of the sale proceeds in fiscal 2006 related to sale-
leaseback transactions. In fiscal 2006, we entered into sale-leaseback transactions involving five superstores valued
at $72.7 million. These transactions were structured with initial lease terms of either 15 or 20 years with four, five-
year renewal options. As of February 29, 2008, we owned 32 superstores currently in operation, as well as our
home office in Richmond, Virginia. In addition, five superstores were accounted for as capital leases.
Financing Activities. Net cash provided by financing activities was $171.0 million in fiscal 2008, $48.1 million in
fiscal 2007 and $3.2 million in fiscal 2006. In fiscal 2008, we increased total debt by $148.9 million, primarily to
fund increased inventory and capital expenditures. We used cash generated from operations to reduce total debt by
$9.5 million in fiscal 2007 and $6.8 million in fiscal 2006.
We have a $500 million revolving credit facility, which is available until December 2011. Borrowings under this
credit facility are available for working capital and general corporate purposes, and are secured by our vehicle
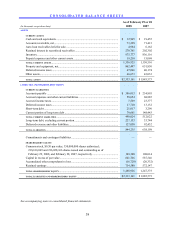
inventory, which was $975.8 million at the end of fiscal 2008. As of February 29, 2008, $300.2 million was
outstanding under the credit facility, with the remainder fully available to us. The outstanding balance included
$21.0 million classified as short-term debt, $79.2 million classified as current portion of long-term debt and $200.0
million classified as long-term debt. We classified $79.2 million of the outstanding balance as of February 29, 2008,
as current portion of long-term debt based on our expectation that this balance will not remain outstanding for more
than one year.
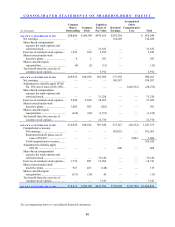
Cash received on equity issuances, which primarily related to employee stock option exercises, was $14.7 million in
fiscal 2008, $35.4 million in fiscal 2007 and $6.0 million in fiscal 2006. The increase in fiscal 2007 reflected


