CarMax 2008 Annual Report Download - page 41
Download and view the complete annual report
Please find page 41 of the 2008 CarMax annual report below. You can navigate through the pages in the report by either clicking on the pages listed below, or by using the keyword search tool below to find specific information within the annual report.-
 1
1 -
2
-
3
-
4
-
5
-
6
-
7
-
8
-
9
-
10
-
11
-
12
-
13
-
14
-
15
-
16
-
17
-
18
-
19
-
20
-
21
-
22
-
23
-
24
-
25
-
26
-
27
-
28
-
29
-
30
-
 31
31 -
 32
32 -
 33
33 -
 34
34 -
 35
35 -
 36
36 -
 37
37 -
 38
38 -
 39
39 -
 40
40 -
 41
41 -
 42
42 -
 43
43 -
 44
44 -
 45
45 -
 46
46 -
 47
47 -
 48
48 -
 49
49 -
 50
50 -
 51
51 -
52
-
53
-
54
-
55
-
56
-
57
-
58
-
59
-
60
-
61
-
62
-
63
-
64
-
65
-
66
-
67
-
68
-
69
-
70
-
71
-
72
-
73
-
74
-
75
-
76
-
77
-
78
-
79
-
80
-
81
-
82
-
83
-
84
-
85
 |
 |

29
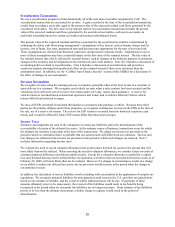
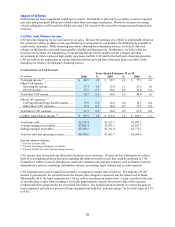
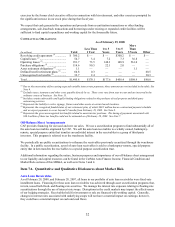
Selling, General and Administrative Expenses
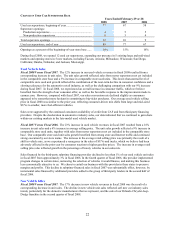
Fiscal 2008 Versus Fiscal 2007. The SG&A ratio increased to 10.5% from 10.4% in fiscal 2007. During fiscal
2008, we increased our SG&A spending related to specific strategic, operational and Internet initiatives intended to
improve customer satisfaction and increase efficiencies over the long term. As a result, our 3% increase in
comparable store used unit sales in fiscal 2008 did not generate sufficient overhead leverage to offset the increases
in spending related to our ongoing growth plan and these initiatives.
Fiscal 2007 Versus Fiscal 2006. The SG&A ratio declined to 10.4% from 10.8% in fiscal 2006. In fiscal 2007, we
benefited from the leverage of fixed expenses generated by our strong comparable store sales growth. The
improvement in the fiscal 2007 SG&A ratio was partially offset by an increase in share-based compensation costs
due to the accelerated vesting of stock options upon the retirement of our former chief executive officer and by the
recognition of an impairment loss totaling $4.9 million, or $0.01 per share. The impairment loss related to the write
down of intangible assets associated with one of our new car franchises, which was subsequently sold.
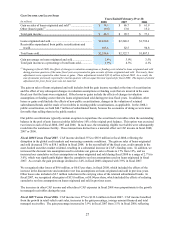
Income Taxes
The effective income tax rate was 38.7% in fiscal 2008, 38.6% in fiscal 2007 and 38.3% in fiscal 2006.
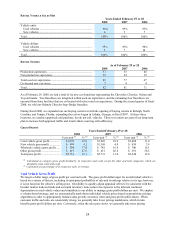
OPERATIONS OUTLOOK
Store Openings and Capital Expenditures
During the fiscal year ending February 28, 2009, we plan to expand our used car superstore base by approximately
16%, opening an estimated 14 used car superstores, including 7 production and 7 non-production stores.
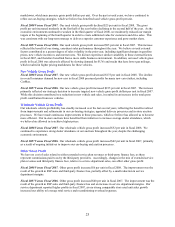
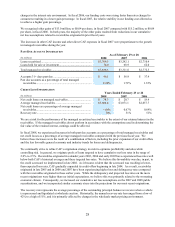
FISCAL 2009 PLANNED SUPERSTORE OPENINGS
Location
Television Market
Market Status
Production
Superstores
Non-production
Superstores
San Antonio, Texas (1)..................... San Antonio............... Existing market....... − 1
Modesto, California (1) .................... Sacramento................ Existing market....... 1 −
Phoenix, Arizona (1) ........................ Phoenix...................... New market............. 1 1
Charleston, South Carolina (1)......... Charleston ................. New market............. − 1
Huntsville, Alabama ....................... Huntsville .................. New market............. 1 −
Colorado Springs, Colorado ........... Colorado Springs....... New market............. 1 −
Costa Mesa, California ................... Los Angeles............... Existing market....... − 1
Tulsa, Oklahoma............................. Tulsa.......................... New market............. 1 −
Hickory, North Carolina................. Charlotte.................... Existing market....... − 1
Augusta, Georgia............................ Augusta ..................... New market............. − 1
Dayton, Ohio .................................. Dayton ....................... New market............. 1 −
Cincinnati, Ohio ............................. Cincinnati .................. New market............. 1 −
Potomac Mills, Virginia ................. D.C. / Baltimore ........ Existing market....... − 1
Total planned openings............................................................................................. 7 7
(1) Opened in March or April 2008.
We expect to enter eight new markets and expand our presence in five existing markets in fiscal 2009. We currently
expect to open approximately nine superstores in the first half of fiscal 2009 and five superstores in the second half
of the fiscal year. However, normal construction, permitting or other scheduling delays could shift opening dates of
any stores into a later period.
In fiscal 2009, we also plan to open a central reconditioning facility in the Washington, D.C. / Baltimore market,
where we currently have six superstores. We have experienced strong sales growth in this market, and this facility
will support additional expected market share gains. In addition, we are converting our non-production store in
Ontario, California, to a production store with the addition of reconditioning facilities, which will support our
continued growth in the Los Angeles market.