CarMax 2008 Annual Report Download - page 34
Download and view the complete annual report
Please find page 34 of the 2008 CarMax annual report below. You can navigate through the pages in the report by either clicking on the pages listed below, or by using the keyword search tool below to find specific information within the annual report.-
 1
1 -
2
-
3
-
4
-
5
-
6
-
7
-
8
-
9
-
10
-
11
-
12
-
13
-
14
-
15
-
16
-
17
-
18
-
19
-
20
-
21
-
22
-
23
-
 24
24 -
 25
25 -
 26
26 -
 27
27 -
 28
28 -
 29
29 -
 30
30 -
 31
31 -
 32
32 -
 33
33 -
 34
34 -
 35
35 -
 36
36 -
 37
37 -
 38
38 -
 39
39 -
 40
40 -
 41
41 -
 42
42 -
 43
43 -
 44
44 -
45
-
46
-
47
-
48
-
49
-
50
-
51
-
52
-
53
-
54
-
55
-
56
-
57
-
58
-
59
-
60
-
61
-
62
-
63
-
64
-
65
-
66
-
67
-
68
-
69
-
70
-
71
-
72
-
73
-
74
-
75
-
76
-
77
-
78
-
79
-
80
-
81
-
82
-
83
-
84
-
85
 |
 |
22
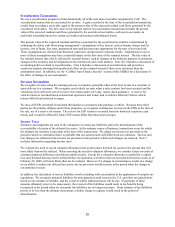
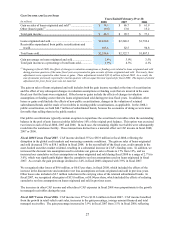
CHANGE IN USED CAR SUPERSTORE BASE
Years Ended February 29 or 28
2008 2007 2006
Used car superstores, beginning of year ................................... 77 67 58
Superstore openings:
Production superstores .......................................................... 4 5 5
Non-production superstores .................................................. 8 5 4
Total superstore openings......................................................... 12 10 9
Used car superstores, end of year ............................................. 89 77 67
Openings as a percent of the beginning-of-year store base ...... 16% 15% 16%
During fiscal 2008, we opened 12 used car superstores, expanding our presence in 5 existing large and mid-sized
markets and opening stores in 5 new markets, including Tucson, Arizona; Milwaukee, Wisconsin; San Diego,
California; Omaha, Nebraska; and Jackson, Mississippi.
Used Vehicle Sales
Fiscal 2008 Versus Fiscal 2007. The 12% increase in our used vehicle revenues in fiscal 2008 resulted from a
corresponding increase in unit sales. The unit sales growth reflected sales from newer superstores not yet included
in the comparable store base and a 3% increase in comparable store used units. This lower-than-normal level of
comparable store used unit growth reflected the combination of the near-term decline in consumer confidence and a
slowing sales pace for the automotive retail industry, as well as the challenging comparison with our 9% increase
during fiscal 2007. In fiscal 2008, we experienced an overall increase in consumer traffic, which we believe
benefited from the strength of our consumer offer, as well as the favorable response to the improvements made to
carmax.com. However, compared with fiscal 2007, our sales conversion rate declined slightly as consumers
appeared to be somewhat more hesitant in committing to big-ticket purchases. Our average used vehicle selling
price in fiscal 2008 was similar to the prior year, reflecting consumer-driven mix shifts from large and mid-sized
SUVs to smaller, more fuel-efficient vehicles.
Sales were supported by the continued consistent availability of credit from CAF and from third-party financing
providers. Despite the deceleration in automotive industry sales, our data indicated that we continued to gain share
within our existing markets in the late-model used vehicle market.
Fiscal 2007 Versus Fiscal 2006. The 23% increase in used vehicle revenues in fiscal 2007 resulted from a 16%
increase in unit sales and a 6% increase in average selling price. The unit sales growth reflected a 9% increase in
comparable store used units, together with sales from newer superstores not yet included in the comparable store
base. Our comparable store used unit sales growth benefited from strong store and Internet traffic and continued
strong execution by our store teams. The increase in the average retail selling price was primarily the result of a
shift in vehicle mix, as we experienced a resurgence in the sales of SUVs and trucks, which we believe had been
adversely affected in the prior year by consumer reaction to higher gasoline prices. The increase in average retail
selling price also reflected growth in the percentage of luxury vehicles in our sales mix.
Sales financed by the third-party subprime financing provider declined to less than 1% of our used vehicle unit sales
in fiscal 2007 from approximately 3% in fiscal 2006. In the fourth quarter of fiscal 2006, this provider implemented
program changes in certain states, narrowing the selection of vehicles it would finance, and making this business
less economically attractive to us. We chose to curtail our business with this provider in these states to preserve
margins and profits. This decline in subprime-financed sales in fiscal 2007 was substantially offset, however, by
incremental sales financed by additional providers added to the group of third-party lenders in the second half of
fiscal 2006.
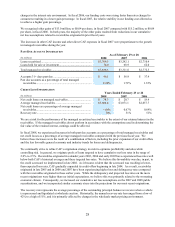
New Vehicle Sales
Fiscal 2008 Versus Fiscal 2007. The 17% decrease in new vehicle revenues in fiscal 2008 was the result of a
corresponding decrease in unit sales. The decline in new vehicle unit sales reflected soft new car industry sales
trends, particularly for the domestic manufacturers that we represent, and the sale of our Orlando Chrysler-Jeep-
Dodge franchise in the second quarter of fiscal 2008.