CarMax 2008 Annual Report Download - page 36
Download and view the complete annual report
Please find page 36 of the 2008 CarMax annual report below. You can navigate through the pages in the report by either clicking on the pages listed below, or by using the keyword search tool below to find specific information within the annual report.-
 1
1 -
2
-
3
-
4
-
5
-
6
-
7
-
8
-
9
-
10
-
11
-
12
-
13
-
14
-
15
-
16
-
17
-
18
-
19
-
20
-
21
-
22
-
23
-
24
-
25
-
 26
26 -
 27
27 -
 28
28 -
 29
29 -
 30
30 -
 31
31 -
 32
32 -
 33
33 -
 34
34 -
 35
35 -
 36
36 -
 37
37 -
 38
38 -
 39
39 -
 40
40 -
 41
41 -
 42
42 -
 43
43 -
 44
44 -
 45
45 -
 46
46 -
47
-
48
-
49
-
50
-
51
-
52
-
53
-
54
-
55
-
56
-
57
-
58
-
59
-
60
-
61
-
62
-
63
-
64
-
65
-
66
-
67
-
68
-
69
-
70
-
71
-
72
-
73
-
74
-
75
-
76
-
77
-
78
-
79
-
80
-
81
-
82
-
83
-
84
-
85
 |
 |
24
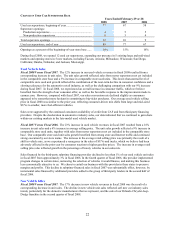
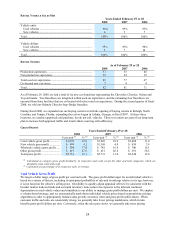
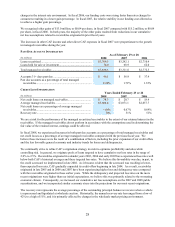
RETAIL VEHICLE SALES MIX
Years Ended February 29 or 28
2008 2007 2006
Vehicle units:
Used vehicles ......................................................................... 96% 95% 93%
New vehicles.......................................................................... 4 5 7
Total........................................................................................... 100% 100% 100%
Vehicle dollars:
Used vehicles ......................................................................... 95% 93% 90%
New vehicles.......................................................................... 5 7 10
Total........................................................................................... 100% 100% 100%
RETAIL STORES
As of February 29 or 28
2008 2007 2006
Production superstores .............................................................. 57 53 48
Non-production superstores ...................................................... 32 24 19
Total used car superstores.......................................................... 89 77 67
Co-located new car stores.......................................................... 3 4 4
Total........................................................................................... 92 81 71
As of February 29, 2008, we had a total of six new car franchises representing the Chevrolet, Chrysler, Nissan and
Toyota brands. Two franchises are integrated within used car superstores, and the remaining four franchises are
operated from three facilities that are co-located with select used car superstores. During the second quarter of fiscal
2008, we sold our Orlando Chrysler-Jeep-Dodge franchise.
During fiscal 2008, we expanded our car-buying center test with the opening of buying centers in Raleigh, North
Carolina, and Tampa, Florida, expanding the test we began in Atlanta, Georgia, in fiscal 2007. At these three
locations, we conduct appraisals and purchase, but do not sell, vehicles. These test centers are part of our long-term
plan to increase both appraisal traffic and retail vehicle sourcing self-sufficiency.
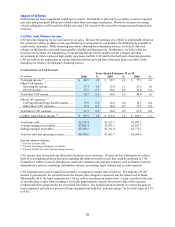
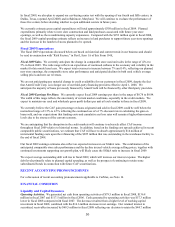
GROSS PROFIT
Years Ended February 29 or 28
2008 2007 2006
$ per unit (1) % (2) $ per unit (1) % (2) $ per unit (1) % (2)
Used vehicle gross profit .............. $1,878 10.8 $1,903 10.9 $1,808 11.0
New vehicle gross profit............... $ 994 4.2 $1,169 4.9 $ 934 3.9
Wholesale vehicle gross profit...... $ 794 17.9 $ 742 16.9 $ 700 16.1
Other gross profit.......................... $ 437 67.5 $ 431 66.8 $ 391 58.5
Total gross profit .......................... $2,731 13.1 $2,731 13.0 $2,544 12.6
(1) Calculated as category gross profit divided by its respective units sold, except the other and total categories, which are
divided by total retail units sold.
(2) Calculated as a percentage of its respective sales or revenue.
Used Vehicle Gross Profit
We target a dollar range of gross profit per used unit sold. The gross profit dollar target for an individual vehicle is
based on a variety of factors, including its anticipated probability of sale and its mileage relative to its age; however,
it is not based on the vehicle’ s selling price. Our ability to quickly adjust appraisal offers to be consistent with the
broader market trade-in trends and our rapid inventory turns reduce the exposure to the inherent continual
depreciation in used vehicle values and contribute to our ability to manage gross profit dollars per unit. We employ
a volume-based strategy, and we systematically mark down individual vehicle prices based on proprietary pricing
algorithms in order to appropriately balance sales growth, inventory turns and gross profit achievement. When
customer traffic and sales are consistently strong, we generally take fewer pricing markdowns, which in turn
benefits gross profit dollars per unit. Conversely, when the sales pace slows, we generally take more pricing