CarMax 2008 Annual Report Download - page 35
Download and view the complete annual report
Please find page 35 of the 2008 CarMax annual report below. You can navigate through the pages in the report by either clicking on the pages listed below, or by using the keyword search tool below to find specific information within the annual report.-
 1
1 -
2
-
3
-
4
-
5
-
6
-
7
-
8
-
9
-
10
-
11
-
12
-
13
-
14
-
15
-
16
-
17
-
18
-
19
-
20
-
21
-
22
-
23
-
24
-
 25
25 -
 26
26 -
 27
27 -
 28
28 -
 29
29 -
 30
30 -
 31
31 -
 32
32 -
 33
33 -
 34
34 -
 35
35 -
 36
36 -
 37
37 -
 38
38 -
 39
39 -
 40
40 -
 41
41 -
 42
42 -
 43
43 -
 44
44 -
 45
45 -
46
-
47
-
48
-
49
-
50
-
51
-
52
-
53
-
54
-
55
-
56
-
57
-
58
-
59
-
60
-
61
-
62
-
63
-
64
-
65
-
66
-
67
-
68
-
69
-
70
-
71
-
72
-
73
-
74
-
75
-
76
-
77
-
78
-
79
-
80
-
81
-
82
-
83
-
84
-
85
 |
 |

23
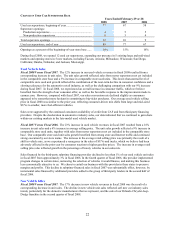
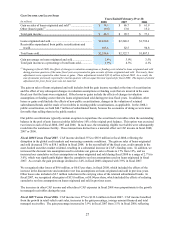
Fiscal 2007 Versus Fiscal 2006. The 11% decrease in new vehicle revenues in fiscal 2007 was substantially the
result of decreases in unit sales, and in part reflected our strategic decision in fiscal 2007 to increase targeted gross
profit dollars per unit on new vehicles. We had anticipated that this decision would result in some reduction in new
vehicle unit sales. The decline in new vehicle unit sales also reflected the effects of reduced industry new car sales
for several of the brands we represent, including Chevrolet, Chrysler and Nissan.
Wholesale Vehicle Sales
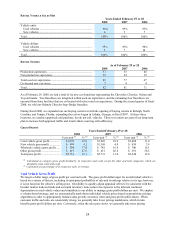
Our operating strategy is to build customer satisfaction by offering high-quality vehicles. Fewer than half of the
vehicles acquired from consumers through the appraisal purchase process meet our standards for reconditioning and
subsequent retail sale. Those vehicles that do not meet our standards are sold through on-site wholesale auctions.
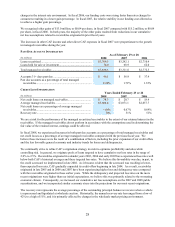
Fiscal 2008 Versus Fiscal 2007. The 7% increase in wholesale vehicle revenues in fiscal 2008 resulted from a 6%
increase in wholesale unit sales combined with a 1% increase in average wholesale selling price. Compared with the
prior year, while appraisal traffic increased, we experienced a decline in our buy rate. Our wholesale auction prices
usually reflect the trends in the general wholesale market for the types of vehicles we sell, although they may also be
affected by changes in vehicle mix or the average age, miles or condition of the vehicles wholesaled.
Fiscal 2007 Versus Fiscal 2006. The 18% increase in wholesale vehicle revenues in fiscal 2007 resulted from a
16% increase in wholesale unit sales and a 1% increase in average wholesale selling price. Our wholesale unit sales
benefited from a substantial increase in appraisal traffic, primarily spurred by our strong comparable store unit sales
growth, and the expansion of our store base. In the first half of fiscal 2007, our average wholesale selling price
climbed 6% reflecting, we believe, the residual effects of industry shortages of older, higher-mileage vehicles
experienced following Hurricanes Katrina, Rita and Wilma in the fall of 2005. In the second half of fiscal 2007, our
average wholesale selling price was 4% below the prior year level reflecting the challenging comparison with the
previous year.
Other Sales and Revenues
Other sales and revenues include commissions on the sale of ESPs, service department sales and third-party finance
fees. The fixed fees paid by third-party financing providers vary by provider, reflecting their differing levels of
credit risk exposure. We record the discount at which the subprime provider purchases loans as an offset to finance
fee revenues received from the other providers.
Fiscal 2008 Versus Fiscal 2007. Other sales and revenues increased 11% in fiscal 2008, similar to the 12%
increase in used vehicle unit sales.
Fiscal 2007 Versus Fiscal 2006. Other sales and revenues increased 10% in fiscal 2007. The increase was
primarily the result of increased sales of ESPs and an increase in third-party finance fees. The increase in ESP sales
was consistent with our increase in used vehicle unit sales. The third-party finance fees increased nearly 50% in
fiscal 2007, benefiting from the decline in sales financed by the subprime provider. Service department sales
declined modestly in fiscal 2007, as the reconditioning activities required to support our strong comparable store
used vehicle sales growth limited the service capacity available for customer pay work.
Supplemental Sales Information
UNIT SALES
Years Ended February 29 or 28
2008 2007 2006
Used vehicles............................................................................. 377,244 337,021 289,888
New vehicles ............................................................................. 15,485 18,563 20,901
Wholesale vehicles .................................................................... 222,406 208,959 179,548
AVERAGE SELLING PRICES
Years Ended February 29 or 28
2008 2007 2006
Used vehicles............................................................................. $17,298 $ 17,249 $ 16,298
New vehicles ............................................................................. $23,795 $ 23,833 $ 23,887
Wholesale vehicles .................................................................... $ 4,319 $ 4,286 $ 4,233