CarMax 2008 Annual Report Download - page 5
Download and view the complete annual report
Please find page 5 of the 2008 CarMax annual report below. You can navigate through the pages in the report by either clicking on the pages listed below, or by using the keyword search tool below to find specific information within the annual report.-
 1
1 -
 2
2 -
 3
3 -
 4
4 -
 5
5 -
 6
6 -
 7
7 -
 8
8 -
 9
9 -
 10
10 -
 11
11 -
 12
12 -
 13
13 -
 14
14 -
 15
15 -
 16
16 -
17
-
18
-
19
-
20
-
21
-
22
-
23
-
24
-
25
-
26
-
27
-
28
-
29
-
30
-
31
-
32
-
33
-
34
-
35
-
36
-
37
-
38
-
39
-
40
-
41
-
42
-
43
-
44
-
45
-
46
-
47
-
48
-
49
-
50
-
51
-
52
-
53
-
54
-
55
-
56
-
57
-
58
-
59
-
60
-
61
-
62
-
63
-
64
-
65
-
66
-
67
-
68
-
69
-
70
-
71
-
72
-
73
-
74
-
75
-
76
-
77
-
78
-
79
-
80
-
81
-
82
-
83
-
84
-
85
 |
 |

CARMAX 2008 | 5
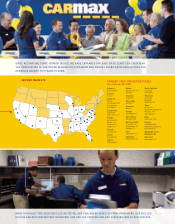
There are two basic aspects of our business that truly differentiate CarMax — the skill and dedication of our
more than 15,000 associates and the strength of our consumer offer. The variety of awards we continue to win attest
to the uniqueness of the CarMax culture and the engagement of our associates.
For the fourth year in a row, we were named one of Fortune’s “100 Best Companies to Work For,” moving this
year from a ranking in the high 80’s into the top 50. Because our ability to attract and retain skilled associates is crit-
ical to our growth, we are doubly glad to again win this award, which assists us in our recruiting efforts. CarMax also
ranked No. 1 on Fortune’s list of America’s Most Admired Companies in the automotive retailing, services industry, was
awarded the 2008 International Torch Award for Marketplace Excellence by the Council of Better Business Bureaus
and received the Gallup Great Workplace Award, all further commentaries on our exceptional corporate reputation.
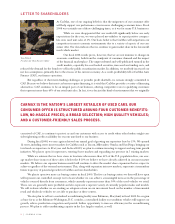
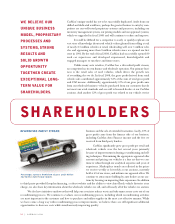
In closing, let me thank all of our associates for their hard work and dedication, our customers for their
loyalty and our shareholders for their confidence in CarMax. We look forward to the unique and exciting long-term
opportunities ahead.
Sincerely,
Tom Folliard
President and Chief Executive Officer
April 25, 2008
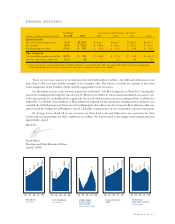
FINANCIAL HIGHLIGHTS
% Change Fiscal Years Ended February 29 or 28 (1)
(Dollars in millions except per share data)
’07 to’08 2008 2007 2006 2005 2004
Operating Results
Net sales and operating revenues 10 % $8,199.6 $7,465.7 $6,260.0 $5,260.3 $4,597.7
Net earnings (8)% $ 182.0 $ 198.6 $ 134.2 $ 101.3 $ 109.6
Diluted earnings per share (10)% $ 0.83 $ 0.92 $ 0.63 $ 0.48 $ 0.52
Other Information
Cash provided by operating activities (42)% $ 79.5 $ 136.8 $ 117.5 $ 41.8 $ 141.4
Used car superstores, at year-end 16 % 89 77 67 58 49
(1) All per share amounts have been adjusted for the effect of the 2-for-1 stock split in March 2007. We adopted SFAS 123R in fiscal 2007, applying the
modified retrospective method, and prior year amounts have been restated for the effect of the adoption.
$8.20
$5.26
$6.26
$7.47
$4.60
0807060504
$198.6
$182.0
$109.6
$101.3
$134.2
0807060504
1
43
9
6
0807060504 0807060504
0807060504
253,168
289,888
337,021
377,244
224,099
9.9%
10.6%
12.7%
10.1%
11.8%
RETURN ON
INVESTED CAPITAL
(Unleveraged)
REVENUES
(In billions)
NET EARNINGS
(In millions)
COMPARABLE
STORE USED
UNIT SALES
(Percentage change)
USED VEHICLES
SOLD