CarMax 2008 Annual Report Download - page 40
Download and view the complete annual report
Please find page 40 of the 2008 CarMax annual report below. You can navigate through the pages in the report by either clicking on the pages listed below, or by using the keyword search tool below to find specific information within the annual report.-
 1
1 -
2
-
3
-
4
-
5
-
6
-
7
-
8
-
9
-
10
-
11
-
12
-
13
-
14
-
15
-
16
-
17
-
18
-
19
-
20
-
21
-
22
-
23
-
24
-
25
-
26
-
27
-
28
-
29
-
 30
30 -
 31
31 -
 32
32 -
 33
33 -
 34
34 -
 35
35 -
 36
36 -
 37
37 -
 38
38 -
 39
39 -
 40
40 -
 41
41 -
 42
42 -
 43
43 -
 44
44 -
 45
45 -
 46
46 -
 47
47 -
 48
48 -
 49
49 -
 50
50 -
51
-
52
-
53
-
54
-
55
-
56
-
57
-
58
-
59
-
60
-
61
-
62
-
63
-
64
-
65
-
66
-
67
-
68
-
69
-
70
-
71
-
72
-
73
-
74
-
75
-
76
-
77
-
78
-
79
-
80
-
81
-
82
-
83
-
84
-
85
 |
 |
28
changes in the interest rate environment. In fiscal 2006, our funding costs were rising faster than rates charged to
consumers resulting in a lower gain percentage. In fiscal 2007, the relative stability in our funding cost allowed us
to achieve a higher gain percentage.
We recognized other gains of $13.0 million, or $0.04 per share, in fiscal 2007 compared with $15.2 million, or $0.04
per share, in fiscal 2006. In both years, the majority of the other gains resulted from reductions in our cumulative
net loss assumptions related to receivables originated in prior fiscal years.
The increases in other CAF income and other direct CAF expenses in fiscal 2007 were proportionate to the growth
in managed receivables during the year.
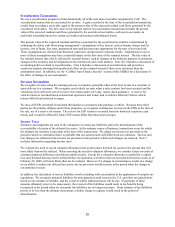
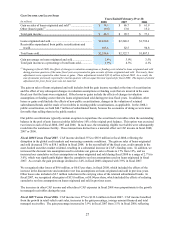
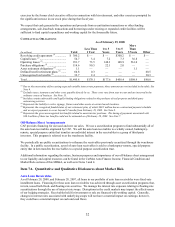
PAST DUE ACCOUNT INFORMATION
As of February 29 or 28
(In millions) 2008 2007 2006
Loans securitized ...................................................................... $ 3,764.5 $ 3,242.1 $ 2,710.4
Loans held for sale or investment............................................. 74.0 68.9 62.0
Total managed receivables ....................................................... $ 3,838.5 $ 3,311.0 $ 2,772.5
Accounts 31+ days past due ..................................................... $ 86.1 $ 56.9 $ 37.4
Past due accounts as a percentage of total managed
receivables............................................................................. 2.24% 1.72% 1.35%
CREDIT LOSS INFORMATION
Years Ended February 29 or 28
(In millions) 2008 2007 2006
Net credit losses on managed receivables................................ $ 38.3 $ 20.7 $ 18.4
Average managed receivables ................................................. $ 3,608.4 $ 3,071.1 $ 2,657.7
Net credit losses as a percentage of average managed
receivables............................................................................ 1.06% 0.67% 0.69%
Recovery rate........................................................................... 50% 51% 51%
We are at risk for the performance of the managed securitized receivables to the extent of our retained interest in the
receivables. If the managed receivables do not perform in accordance with the assumptions used in determining the
fair value of the retained interest, earnings could be affected.
In fiscal 2008, we experienced increases in both past due accounts as a percentage of total managed receivables and
net credit losses as a percentage of average managed receivables compared with the previous fiscal year. We
believe these increases were the result of a combination of factors, including the prior expansion of our credit offers
and the less favorable general economic and industry trends for losses and delinquencies.
We continually strive to refine CAF’ s origination strategy in order to optimize profitability and sales while
controlling risk. In general, we originate pools of loans targeted to have cumulative net loss rates in the range of
2.0% to 2.5%. Receivables originated in calendar years 2003, 2004 and early 2005 have experienced loss rates well
below both CAF’ s historical averages and these targeted loss rates. We believe this favorability was due, in part, to
the credit scorecard we implemented in late 2002. As it became evident that the scorecard was resulting in lower-
than-expected loss rates, CAF gradually expanded its credit offers beginning in late 2004. As a result, receivables
originated in late 2005 and in 2006 and 2007 have been experiencing higher loss and delinquency rates compared
with the receivables originated in these earlier years. While the delinquency and projected loss rates on the more
recent originations were higher than our initial expectations, we believe this was primarily related to the worsening
economic climate. Consequently, we increased our cumulative net loss assumptions on the 2007 and 2008 public
securitizations, and we incorporated similar economic stress into the projections for our most recent originations.
The recovery rate represents the average percentage of the outstanding principal balance we receive when a vehicle
is repossessed and liquidated at wholesale auction. Historically, the annual recovery rate has ranged from a low of
42% to a high of 51%, and it is primarily affected by changes in the wholesale market pricing environment.