CarMax 2008 Annual Report Download - page 38
Download and view the complete annual report
Please find page 38 of the 2008 CarMax annual report below. You can navigate through the pages in the report by either clicking on the pages listed below, or by using the keyword search tool below to find specific information within the annual report.-
 1
1 -
2
-
3
-
4
-
5
-
6
-
7
-
8
-
9
-
10
-
11
-
12
-
13
-
14
-
15
-
16
-
17
-
18
-
19
-
20
-
21
-
22
-
23
-
24
-
25
-
26
-
27
-
 28
28 -
 29
29 -
 30
30 -
 31
31 -
 32
32 -
 33
33 -
 34
34 -
 35
35 -
 36
36 -
 37
37 -
 38
38 -
 39
39 -
 40
40 -
 41
41 -
 42
42 -
 43
43 -
 44
44 -
 45
45 -
 46
46 -
 47
47 -
 48
48 -
49
-
50
-
51
-
52
-
53
-
54
-
55
-
56
-
57
-
58
-
59
-
60
-
61
-
62
-
63
-
64
-
65
-
66
-
67
-
68
-
69
-
70
-
71
-
72
-
73
-
74
-
75
-
76
-
77
-
78
-
79
-
80
-
81
-
82
-
83
-
84
-
85
 |
 |

26
Impact of Inflation
Inflation has not been a significant contributor to results. Profitability is affected by our ability to achieve targeted
unit sales and gross profit dollars per vehicle rather than on average retail prices. However, increases in average
vehicle selling prices will benefit the SG&A ratio and CAF income to the extent the average amount financed also
increases.
CarMax Auto Finance Income
CAF provides financing for our used and new car sales. Because the purchase of a vehicle is traditionally reliant on
the consumer’ s ability to obtain on-the-spot financing, it is important to our business that financing be available to
creditworthy customers. While financing can also be obtained from third-party sources, we believe that total
reliance on third parties can create unacceptable volatility and business risk. Furthermore, we believe that our
processes and systems, the transparency of our pricing and our vehicle quality provide a unique and ideal
environment in which to procure high quality auto loans, both for CAF and for the third-party financing providers.
CAF provides us the opportunity to capture additional profits and cash flows from auto loan receivables while
managing our reliance on third-party financing sources.
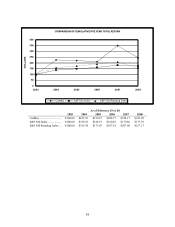
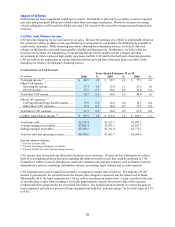
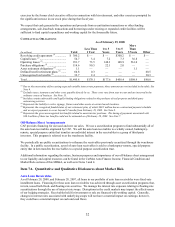
COMPONENTS OF CAF INCOME
Years Ended February 29 or 28
(In millions) 2008 % 2007 % 2006 %
Total gain income (1) ........................................ $ 48.5 1.9 $ 99.7 4.3 $ 77.1 4.1
Other CAF income: (2)
Servicing fee income.................................... 37.4 1.0 32.4 1.1 27.6 1.0
Interest income............................................. 33.3 0.9 26.6 0.9 21.4 0.8
Total other CAF income .................................. 70.7 2.0 59.0 1.9 49.0 1.8
Direct CAF expenses: (2)
CAF payroll and fringe benefit expense ...... 15.9 0.4 12.0 0.4 10.3 0.4
Other direct CAF expenses .......................... 17.4 0.5 14.0 0.5 11.5 0.4
Total direct CAF expenses............................... 33.3 0.9 26.0 0.9 21.8 0.8
CarMax Auto Finance income (3)..................... $ 85.9 1.0 $ 132.6 1.8 $ 104.3 1.7
Total loans sold................................................ $ 2,534.4 $ 2,322.7 $ 1,887.5
Average managed receivables ......................... $ 3,608.4 $ 3,071.1 $ 2,657.7
Ending managed receivables ........................... $ 3,838.5 $ 3,311.0 $ 2,772.5
Total net sales and operating revenues ............ $ 8,199.6 $ 7,465.7 $ 6,260.0
Percent columns indicate:
(1) Percent of loans sold.
(2) Percent of average managed receivables.
(3) Percent of total net sales and operating revenues.
CAF income does not include any allocation of indirect costs or income. We present this information on a direct
basis to avoid making arbitrary decisions regarding the indirect benefit or costs that could be attributed to CAF.
Examples of indirect costs not included are retail store expenses and corporate expenses such as human resources,
administrative services, marketing, information systems, accounting, legal, treasury and executive payroll.
CAF originates auto loans to qualified customers at competitive market rates of interest. The majority of CAF
income is generated by the spread between the interest rates charged to customers and the related cost of funds.
Substantially all of the loans originated by CAF are sold in securitization transactions. A gain, recorded at the time
of securitization, results from recording a receivable approximately equal to the present value of the expected
residual cash flows generated by the securitized receivables. In a normalized environment, we expect the gain on
loans originated and sold as a percent of loans originated and sold (the “gain percentage”) to be in the range of 3.5%
to 4.5%.