CarMax 2008 Annual Report Download - page 60
Download and view the complete annual report
Please find page 60 of the 2008 CarMax annual report below. You can navigate through the pages in the report by either clicking on the pages listed below, or by using the keyword search tool below to find specific information within the annual report.-
 1
1 -
2
-
3
-
4
-
5
-
6
-
7
-
8
-
9
-
10
-
11
-
12
-
13
-
14
-
15
-
16
-
17
-
18
-
19
-
20
-
21
-
22
-
23
-
24
-
25
-
26
-
27
-
28
-
29
-
30
-
31
-
32
-
33
-
34
-
35
-
36
-
37
-
38
-
39
-
40
-
41
-
42
-
43
-
44
-
45
-
46
-
47
-
48
-
49
-
 50
50 -
 51
51 -
 52
52 -
 53
53 -
 54
54 -
 55
55 -
 56
56 -
 57
57 -
 58
58 -
 59
59 -
 60
60 -
 61
61 -
 62
62 -
 63
63 -
 64
64 -
 65
65 -
 66
66 -
 67
67 -
 68
68 -
 69
69 -
 70
70 -
71
-
72
-
73
-
74
-
75
-
76
-
77
-
78
-
79
-
80
-
81
-
82
-
83
-
84
-
85
 |
 |
48
receivables with the warehouse agent on a daily basis, deliver executed lockbox agreements to the warehouse
facility agent and obtain a replacement counterparty for the interest rate cap agreement related to the warehouse
facility. As of February 29, 2008, we were in compliance with the financial covenants and the securitized
receivables were in compliance with the performance triggers.
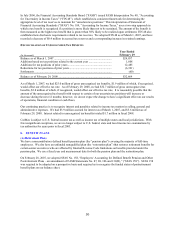
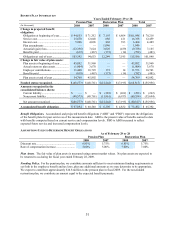
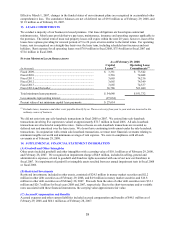
5. FINANCIAL DERIVATIVES
We utilize interest rate swaps relating to our auto loan receivable securitizations and our investment in retained
subordinated bonds. Swaps are used to better match funding costs to the interest on the fixed-rate receivables being
securitized and the retained subordinated bonds and to minimize the funding costs related to certain of our
securitization trusts. During fiscal 2008, we entered into 74 interest rate swaps with initial notional amounts totaling
$2.27 billion and terms ranging from 16 to 46 months. The amortized notional amount of outstanding swaps was
approximately $898.7 million as of February 29, 2008, and $597.5 million as of February 28, 2007. The fair value
of swaps included in accounts payable totaled a net liability of $15.1 million as of February 29, 2008, and $1.0
million as of February 28, 2007.
The market and credit risks associated with interest rate swaps are similar to those relating to other types of financial
instruments. Market risk is the exposure created by potential fluctuations in interest rates. We do not anticipate
significant market risk from swaps as they are predominantly used to match funding costs to the use of the funding.
However, disruptions in the credit markets could impact the effectiveness of our hedging strategies. Credit risk is
the exposure to nonperformance of another party to an agreement. We mitigate credit risk by dealing with highly
rated bank counterparties.
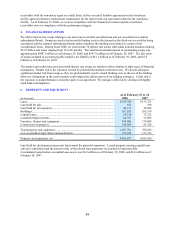
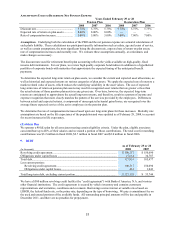
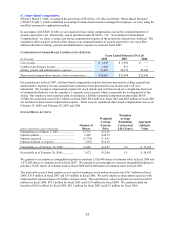
6. PROPERTY AND EQUIPMENT
As of February 29 or 28
(In thousands) 2008 2007
Land........................................................................................................................ $ 162,786 $ 133,231
Land held for sale ................................................................................................... 921 918
Land held for development..................................................................................... 42,311 38,884
Buildings................................................................................................................. 397,183 265,159
Capital leases .......................................................................................................... 29,258 37,122
Leasehold improvements ........................................................................................ 64,947 53,696
Furniture, fixtures and equipment........................................................................... 199,996 174,884
Construction in progress......................................................................................... 140,389 85,328
Total property and equipment................................................................................. 1,037,791 789,222
Less accumulated depreciation and amortization ............................................................. 175,294 137,372
Property and equipment, net................................................................................... $ 862,497 $ 651,850
Land held for development represents land owned for potential expansion. Leased property meeting capital lease
criteria is capitalized and the present value of the related lease payments is recorded as long-term debt.
Accumulated amortization on capital lease assets was $6.2 million as of February 29, 2008, and $6.0 million as of
February 28, 2007.