CarMax 2008 Annual Report Download - page 27
Download and view the complete annual report
Please find page 27 of the 2008 CarMax annual report below. You can navigate through the pages in the report by either clicking on the pages listed below, or by using the keyword search tool below to find specific information within the annual report.-
 1
1 -
2
-
3
-
4
-
5
-
6
-
7
-
8
-
9
-
10
-
11
-
12
-
13
-
14
-
15
-
16
-
 17
17 -
 18
18 -
 19
19 -
 20
20 -
 21
21 -
 22
22 -
 23
23 -
 24
24 -
 25
25 -
 26
26 -
 27
27 -
 28
28 -
 29
29 -
 30
30 -
 31
31 -
 32
32 -
 33
33 -
 34
34 -
 35
35 -
 36
36 -
 37
37 -
38
-
39
-
40
-
41
-
42
-
43
-
44
-
45
-
46
-
47
-
48
-
49
-
50
-
51
-
52
-
53
-
54
-
55
-
56
-
57
-
58
-
59
-
60
-
61
-
62
-
63
-
64
-
65
-
66
-
67
-
68
-
69
-
70
-
71
-
72
-
73
-
74
-
75
-
76
-
77
-
78
-
79
-
80
-
81
-
82
-
83
-
84
-
85
 |
 |

15
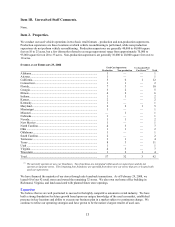
PART II
Item 5. Market for Registrant’s Common Equity, Related Stockholder Matters and Issuer
Purchases of Equity Securities.
Our common stock is listed and traded on the New York Stock Exchange under the ticker symbol KMX.
As of February 29, 2008, there were approximately 7,000 CarMax shareholders of record.
The following table sets forth for the fiscal periods indicated, the high and low sales prices per share for our
common stock, as reported on the New York Stock Exchange composite tape and adjusted for the effect of the
2-for-1 stock split in March 2007.
First
Quarter
Second
Quarter
Third
Quarter
Fourth
Quarter
Fiscal 2008
High ................................................... $27.75 $27.42 $25.38 $23.47
Low .................................................... $22.63 $20.33 $18.67 $15.81
Fiscal 2007
High ................................................... $18.20 $18.95 $23.99 $29.44
Low .................................................... $15.14 $14.85 $18.59 $23.10
To date, we have not paid a cash dividend on CarMax common stock. We presently intend to retain our net earnings
for use in our operations and for geographic expansion and, therefore, we do not anticipate paying any cash
dividends in the foreseeable future.
During the fourth quarter of fiscal 2008, we sold no CarMax equity securities that were not registered under the
Securities Act of 1933, as amended. In addition, we did not repurchase any CarMax equity securities during this
period.
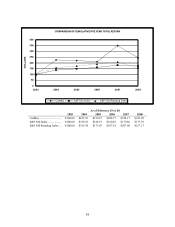
Performance Graph
The following graph compares the five-year cumulative total return among CarMax common stock, the S&P 500
Index and the S&P 500 Retailing Index. The graph assumes an original investment of $100 in our common stock
and in each index on February 28, 2003, and the reinvestment of dividends, if applicable.