CarMax 2008 Annual Report Download - page 37
Download and view the complete annual report
Please find page 37 of the 2008 CarMax annual report below. You can navigate through the pages in the report by either clicking on the pages listed below, or by using the keyword search tool below to find specific information within the annual report.-
 1
1 -
2
-
3
-
4
-
5
-
6
-
7
-
8
-
9
-
10
-
11
-
12
-
13
-
14
-
15
-
16
-
17
-
18
-
19
-
20
-
21
-
22
-
23
-
24
-
25
-
26
-
 27
27 -
 28
28 -
 29
29 -
 30
30 -
 31
31 -
 32
32 -
 33
33 -
 34
34 -
 35
35 -
 36
36 -
 37
37 -
 38
38 -
 39
39 -
 40
40 -
 41
41 -
 42
42 -
 43
43 -
 44
44 -
 45
45 -
 46
46 -
 47
47 -
48
-
49
-
50
-
51
-
52
-
53
-
54
-
55
-
56
-
57
-
58
-
59
-
60
-
61
-
62
-
63
-
64
-
65
-
66
-
67
-
68
-
69
-
70
-
71
-
72
-
73
-
74
-
75
-
76
-
77
-
78
-
79
-
80
-
81
-
82
-
83
-
84
-
85
 |
 |
25
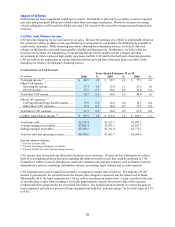
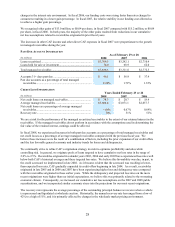
markdowns, which may pressure gross profit dollars per unit. Over the past several years, we have continued to
refine our car-buying strategies, which we believe has benefited used vehicle gross profit per unit.
Fiscal 2008 Versus Fiscal 2007. Our used vehicle gross profit declined $25 per unit in fiscal 2008. The gross
profit per unit increased modestly in the first half of the year before declining in the second half of the year. As the
economic environment continued to weaken in the third quarter of fiscal 2008, we moderately reduced our margin
targets at the beginning of the fourth quarter in order to create additional value for customers and drive sales. This
was consistent with our long-term strategy to deliver a superior customer experience and grow market share.
Fiscal 2007 Versus Fiscal 2006. Our used vehicle gross profit increased $95 per unit in fiscal 2007. This increase
reflected the benefit of our strong, consistent sales performance throughout the year. We believe several external
factors contributed to a greater degree of sales volatility in the prior year, including significant changes in gasoline
prices, new vehicle incentives and interest rates. We did not experience similar variability in these external factors
in fiscal 2007, and therefore benefited from a more stable business environment. In addition, our used vehicle gross
profit in fiscal 2006 was adversely affected by slowing demand for SUVs and trucks that have lower gas mileage,
which resulted in higher pricing markdowns for these vehicles.
New Vehicle Gross Profit
Fiscal 2008 Versus Fiscal 2007. Our new vehicle gross profit decreased $175 per unit in fiscal 2008. The decline
in overall consumer demand for new cars in fiscal 2008 pressured profits for many new car retailers, including
CarMax.
Fiscal 2007 Versus Fiscal 2006. Our new vehicle gross profit increased $235 per unit in fiscal 2007. The increase
primarily reflected our strategic decision to increase targeted new vehicle gross profit dollars per unit in fiscal 2007.
While this decision contributed to a reduction in new vehicle unit sales, it resulted in an increase in the total gross
profit contribution from new vehicles.
Wholesale Vehicle Gross Profit
Our wholesale vehicle profitability has steadily increased over the last several years, reflecting the benefits realized
from improvements and refinements in our car-buying strategies, appraisal delivery processes and in-store auction
processes. We have made continuous improvements in these processes, which we believe has allowed us to become
more efficient. Our in-store auctions have benefited from initiatives to increase average dealer attendance, which
we believe has allowed us to achieve higher prices.
Fiscal 2008 Versus Fiscal 2007. Our wholesale vehicle gross profit increased $52 per unit in fiscal 2008. We
continued to experience strong dealer attendance at our auctions throughout the year, despite the challenging
economic environment.
Fiscal 2007 Versus Fiscal 2006. Our wholesale vehicle gross profit increased $42 per unit in fiscal 2007, primarily
as a result of ongoing initiatives to improve our car-buying and auction processes.
Other Gross Profit
We have no cost of sales related to either extended service plan revenues or third-party finance fees, as these
represent commissions paid to us by the third-party providers. Accordingly, changes in the mix of extended service
plan revenues and third-party finance fees, relative to service department sales, can affect other gross profit.
Fiscal 2008 Versus Fiscal 2007. Other gross profit increased $6 per unit in fiscal 2008. The improvement was the
result of the growth in ESP sales and third-party finance fees, partially offset by a small reduction in service
department margins.
Fiscal 2007 Versus Fiscal 2006. Other gross profit increased $40 per unit in fiscal 2007. The improvement was the
result of the growth in ESP sales and third-party finance fees and an increase in service department margins. Our
service department reported higher profits in fiscal 2007, as our strong comparable store used unit sales growth
increased our ability to leverage total service and reconditioning overhead expenses.