CarMax 2008 Annual Report Download - page 39
Download and view the complete annual report
Please find page 39 of the 2008 CarMax annual report below. You can navigate through the pages in the report by either clicking on the pages listed below, or by using the keyword search tool below to find specific information within the annual report.-
 1
1 -
2
-
3
-
4
-
5
-
6
-
7
-
8
-
9
-
10
-
11
-
12
-
13
-
14
-
15
-
16
-
17
-
18
-
19
-
20
-
21
-
22
-
23
-
24
-
25
-
26
-
27
-
28
-
 29
29 -
 30
30 -
 31
31 -
 32
32 -
 33
33 -
 34
34 -
 35
35 -
 36
36 -
 37
37 -
 38
38 -
 39
39 -
 40
40 -
 41
41 -
 42
42 -
 43
43 -
 44
44 -
 45
45 -
 46
46 -
 47
47 -
 48
48 -
 49
49 -
50
-
51
-
52
-
53
-
54
-
55
-
56
-
57
-
58
-
59
-
60
-
61
-
62
-
63
-
64
-
65
-
66
-
67
-
68
-
69
-
70
-
71
-
72
-
73
-
74
-
75
-
76
-
77
-
78
-
79
-
80
-
81
-
82
-
83
-
84
-
85
 |
 |

27
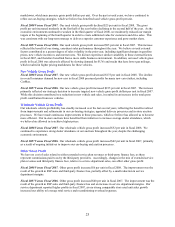
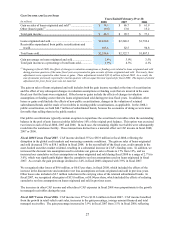
GAIN INCOME AND LOANS SOLD
Years Ended February 29 or 28
(In millions) 2008 2007 2006
Gain on sales of loans originated and sold(1) ............................ $ 58.1 $ 86.7 $ 61.9
Other (losses) gains(1) ............................................................... (9.6) 13.0 15.2
Total gain income ..................................................................... $ 48.5 $ 99.7 $ 77.1
Loans originated and sold......................................................... $ 2,430.8 $ 2,240.2 $ 1,792.6
Receivables repurchased from public securitizations and
resold..................................................................................... 103.6 82.5 94.8
Total loans sold......................................................................... $ 2,534.4 $ 2,322.7 $ 1,887.5
Gain percentage on loans originated and sold .......................... 2.4% 3.9% 3.5%
Total gain income as a percentage of total loans sold............... 1.9% 4.3% 4.1%
(1) Beginning in fiscal 2008, the effects of changes in valuation assumptions or funding costs related to loans originated and sold
during previous quarters of the same fiscal year are presented in gain on sales of loans originated and sold. Previously, these
adjustments were reported in other losses or gains. These adjustments totaled $(35.9) million in fiscal 2008. As a result, the
sum of amounts previously reported for interim quarters will not equal the total reported for fiscal 2008. The impact of similar
adjustments for prior fiscal years was not material.
The gain on sales of loans originated and sold includes both the gain income recorded at the time of securitization
and the effect of any subsequent changes in valuation assumptions or funding costs that are incurred in the same
fiscal year that the loans were originated. Other losses or gains include the effects of changes in valuation
assumptions or funding costs related to loans originated and sold during previous fiscal years. In addition, other
losses or gains could include the effects of new public securitizations, changes in the valuation of retained
subordinated bonds and the resale of receivables in existing public securitizations, as applicable. In the 2008-1
public securitization, we held $44.7 million of subordinated bonds, because the economics of doing so were more
favorable than selling them in the public market.
Our public securitizations typically contain an option to repurchase the securitized receivables when the outstanding
balance in the pool of auto loan receivables falls below 10% of the original pool balance. This option was exercised
two times in each of fiscal 2008, 2007 and 2006. In each case, the remaining eligible receivables were subsequently
resold into the warehouse facility. These transactions did not have a material effect on CAF income in fiscal 2008,
2007 or 2006.
Fiscal 2008 Versus Fiscal 2007. CAF income declined 35% to $85.9 million in fiscal 2008, reflecting the
disruption in the global credit markets and worsening economic conditions. The gain on sales of loans originated
and sold decreased 33% to $58.1 million in fiscal 2008. In the second half of the fiscal year, credit spreads in the
asset-backed securities market widened, resulting in a substantial increase in CAF’ s funding costs. In addition, we
increased the discount rate assumption used to calculate our gain on sales of loans to 17% from 12%, and we
increased our cumulative net loss assumptions on loans originated and sold during fiscal 2008 to a range of 2.7% to
3.0%, which was significantly higher than the cumulative net loss assumptions used on loans originated in fiscal
2007. As a result, the gain percentage declined to 2.4% in fiscal 2008 compared with 3.9% in fiscal 2007.
We recognized other losses of $9.6 million, or $0.03 per share, in fiscal 2008, which included the effects of the
increase in the discount rate and cumulative net loss assumptions on loans originated and sold in previous years.
Other losses also included a $2.7 million reduction in the carrying value of the retained subordinated bonds. In
fiscal 2007, we recognized other gains of $13.0 million, or $0.04 per share, which included the effects of reducing
cumulative net loss assumptions on loans originated and sold in previous years.
The increases in other CAF income and other direct CAF expenses in fiscal 2008 were proportionate to the growth
in managed receivables during the year.
Fiscal 2007 Versus Fiscal 2006. CAF income rose 27% to $132.6 million in fiscal 2007. CAF income benefited
from the growth in retail vehicle unit sales, increases in the gain percentage, average amount financed and total
managed receivables. The gain percentage increased to 3.9% in fiscal 2007 from 3.5% in fiscal 2006, reflecting