CVS 2010 Annual Report Download - page 78
Download and view the complete annual report
Please find page 78 of the 2010 CVS annual report below. You can navigate through the pages in the report by either clicking on the pages listed below, or by using the keyword search tool below to find specific information within the annual report.-
 1
1 -
2
-
3
-
4
-
5
-
6
-
7
-
8
-
9
-
10
-
11
-
12
-
13
-
14
-
15
-
16
-
17
-
18
-
19
-
20
-
21
-
22
-
23
-
24
-
25
-
26
-
27
-
28
-
29
-
30
-
31
-
32
-
33
-
34
-
35
-
36
-
37
-
38
-
39
-
40
-
41
-
42
-
43
-
44
-
45
-
46
-
47
-
48
-
49
-
50
-
51
-
52
-
53
-
54
-
55
-
56
-
57
-
58
-
59
-
60
-
61
-
62
-
63
-
64
-
65
-
66
-
67
-
 68
68 -
 69
69 -
 70
70 -
 71
71 -
 72
72 -
 73
73 -
 74
74 -
 75
75 -
 76
76 -
 77
77 -
 78
78 -
 79
79 -
 80
80 -
 81
81 -
 82
82
 |
 |

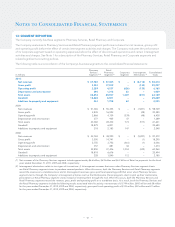
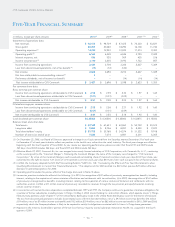
Five-Year Financial Summary
in millions, except per share amounts 2010 (1) 2009 (1) 2008 (1) 2007 (1) (2) 2006 (1)
Statement of operations data:
Net revenues $ 96,413 $ 98,729 $ 87,472 $ 76,330 $ 43,821
Gross profit 20,257 20,380 18,290 16,108 11,742
Operating expenses (3) 14,092 13,942 12,244 11,314 9,300
Operating profit (4) 6,165 6,438 6,046 4,794 2,442
Interest expense, net 536 525 509 435 216
Income tax provision (5) 2,190 2,205 2,193 1,722 857
Income from continuing operations 3,439 3,708 3,344 2,637 1,369
Loss from discontinued operations, net of tax benefit (6) (15) (12) (132) – –
Net income 3,424 3,696 3,212 2,637 1,369
Net loss attributable to noncontrolling interest (7) 3 – – – –
Preference dividends, net of income tax benefit – – (14) (14) (14)
Net income attributable to CVS Caremark $ 3,427 $ 3,696 $ 3,198 $ 2,623 $ 1,355
Per common share data:
Basic earnings per common share:
Income from continuing operations attributable to CVS Caremark $ 2.52 $ 2.59 $ 2.32 $ 1.97 $ 1.65
Loss from discontinued operations attributable to CVS Caremark (0.01) (0.01) (0.09) – –
Net income attributable to CVS Caremark $ 2.51 $ 2.58 $ 2.23 $ 1.97 $ 1.65
Diluted earnings per common share:
Income from continuing operations attributable to CVS Caremark $ 2.50 $ 2.56 $ 2.27 $ 1.92 $ 1.60
Loss from discontinued operations attributable to CVS Caremark (0.01) (0.01) (0.09) – –
Net income attributable to CVS Caremark $ 2.49 $ 2.55 $ 2.18 $ 1.92 $ 1.60
Cash dividends per common share $ 0.35000 $ 0.30500 $ 0.25800 $ 0.22875 $ 0.15500
Balance sheet and other data:
Total assets $ 62,169 $ 61,641 $ 60,960 $ 54,722 $ 20,574
Long-term debt $ 8,652 $ 8,756 $ 8,057 $ 8,350 $ 2,870
Total shareholders’ equity $ 37,700 $ 35,768 $ 34,574 $ 31,322 $ 9,918
Number of stores (at end of year) 7,226 7,074 6,981 6,301 6,205
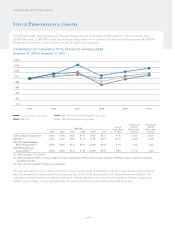
(1) On December 23, 2008, our Board of Directors approved a change in our fiscal year-end from the Saturday nearest December 31 of each year
to December 31 of each year to better reflect our position in the health care, rather than the retail, industry. The fiscal year change was effective
beginning with the fourth quarter of fiscal 2008. As you review our operating performance, please consider that fiscal 2010 and 2009 include
365 days; fiscal 2008 includes 368 days, and fiscal 2007 and 2006 include 364 days.
(2) Effective March 22, 2007, Caremark Rx, Inc. was merged into a newly formed subsidiary of CVS Corporation, with Caremark Rx, L.L.C., continuing
as the surviving entity (the “Caremark Merger”). Following the Caremark Merger, the name of the Company was changed to “CVS Caremark
Corporation.” By virtue of the Caremark Merger, each issued and outstanding share of Caremark common stock, par value $0.001 per share, was
converted into the right to receive 1.67 shares of CVS Caremark’s common stock, par value $0.01 per share. Cash was paid in lieu of fractional shares.
(3) In 2006, the Company adopted the SEC Staff Accounting Bulletin (“SAB”) No. 108, “Considering the Effects of Prior Year Misstatements when
Qualifying Misstatements in Current Year Financial Statements.” The adoption of this SAB resulted in a $40 million pre-tax ($25 million after-tax)
decrease in operating expenses for 2006.
(4) Operating profit includes the pre-tax effect of the charge discussed in Note (3) above.
(5) Income tax provision includes the effect of the following: (i) in 2010, the recognition of $47 million of previously unrecognized tax benefits, including
interest, relating to the expiration of various statutes of limitation and settlements with tax authorities, (ii) in 2009, the recognition of $167 million
of previously unrecognized tax benefits, including interest, relating to the expiration of various statutes of limitation and settlements with tax
authorities, and (iii) in 2006, a $11 million reversal of previously recorded tax reserves through the tax provision principally based on resolving
certain state tax matters.
(6) In connection with certain business dispositions completed between 1991 and 1997, the Company continues to guarantee store lease obligations for
a number of former subsidiaries, including Linens ‘n Things. On May 2, 2008, Linens Holding Co. and certain affiliates, which operate Linens ‘n Things,
filed voluntary petitions under Chapter 11 of the United States Bankruptcy Code in the United States Bankruptcy Court for the District of Delaware.
The loss from discontinued operations includes lease-related costs of $15 million ($24 million, net of a $9 million income tax benefit), $12 million
($19 million, net of an $7 million income tax benefit) and $132 million ($214 million, net of an $82 million income tax benefit) in 2010, 2009 and 2008,
respectively, which the Company believes is likely to be required to satisfy its obligations associated with its Linens ‘n Things lease guarantees.
(7) Represents the minority shareholders’ portion of the net loss from our majority owned subsidiary Generation Health, Inc. acquired in the fourth
quarter of 2009.
– 74 –
CVS Caremark 2010 Annual Report