CVS 2010 Annual Report Download - page 77
Download and view the complete annual report
Please find page 77 of the 2010 CVS annual report below. You can navigate through the pages in the report by either clicking on the pages listed below, or by using the keyword search tool below to find specific information within the annual report.-
 1
1 -
2
-
3
-
4
-
5
-
6
-
7
-
8
-
9
-
10
-
11
-
12
-
13
-
14
-
15
-
16
-
17
-
18
-
19
-
20
-
21
-
22
-
23
-
24
-
25
-
26
-
27
-
28
-
29
-
30
-
31
-
32
-
33
-
34
-
35
-
36
-
37
-
38
-
39
-
40
-
41
-
42
-
43
-
44
-
45
-
46
-
47
-
48
-
49
-
50
-
51
-
52
-
53
-
54
-
55
-
56
-
57
-
58
-
59
-
60
-
61
-
62
-
63
-
64
-
65
-
66
-
 67
67 -
 68
68 -
 69
69 -
 70
70 -
 71
71 -
 72
72 -
 73
73 -
 74
74 -
 75
75 -
 76
76 -
 77
77 -
 78
78 -
 79
79 -
 80
80 -
 81
81 -
 82
82
 |
 |

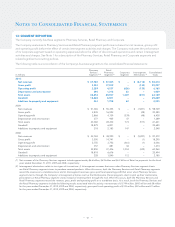
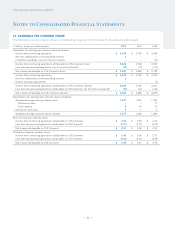
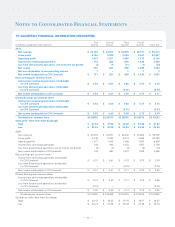
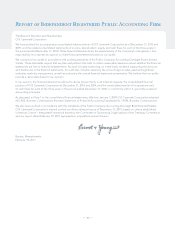
Notes to Consolidated Financial Statements
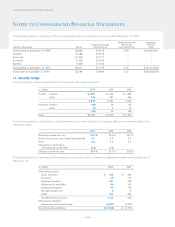
15: QUARTERLY FINANCIAL INFORMATION (UNAUDITED)
First Second Third Fourth
in millions, except per share amounts Quarter Quarter Quarter Quarter Fiscal Year
2010:
Net revenues $ 23,760 $ 24,007 $ 23,875 $ 24,771 $ 96,413
Gross profit 4,746 5,020 5,024 5,467 20,257
Operating profit 1,410 1,501 1,484 1,770 6,165
Income from continuing operations 772 822 819 1,026 3,439
Loss from discontinued operations, net of income tax benefit (2) (1) (11) (1) (15)
Net income 770 821 808 1,025 3,424
Net loss attributable to noncontrolling interest 1 – 1 1 3
Net income attributable to CVS Caremark $ 771 $ 821 $ 809 $ 1,026 $ 3,427
Basic earnings per common share:
Income from continuing operations attributable
to CVS Caremark $ 0.56 $ 0.61 $ 0.60 $ 0.75 $ 2.52
Loss from discontinued operations attributable
to CVS Caremark – – (0.01) – (0.01)
Net income attributable to CVS Caremark $ 0.56 $ 0.61 $ 0.59 $ 0.75 $ 2.51
Diluted Earnings per common share:
Income from continuing operations attributable
to CVS Caremark $ 0.55 $ 0.60 $ 0.60 $ 0.75 $ 2.50
Loss from discontinued operations attributable
to CVS Caremark – – (0.01) – (0.01)
Net income attributable to CVS Caremark $ 0.55 $ 0.60 $ 0.59 $ 0.75 $ 2.49
Dividends per common share $ 0.08750 $ 0.08750 $ 0.08750 $ 0.08750 $ 0.35000
Stock price: (New York Stock Exchange)
High $ 37.32 $ 37.82 $ 32.09 $ 35.46 $ 37.82
Low $ 30.36 $ 29.22 $ 26.84 $ 29.45 $ 26.84
2009:
Net revenues $ 23,394 $ 24,871 $ 24,642 $ 25,822 $ 98,729
Gross profit 4,748 5,052 5,012 5,568 20,380
Operating profit 1,377 1,600 1,566 1,895 6,438
Income from continuing operations 744 890 1,023 1,051 3,708
Loss from discontinued operations, net of income tax benefit (5) (3) (2) (2) (12)
Net income attributable to CVS Caremark 739 887 1,021 1,049 3,696
Basic earnings per common share:
Income from continuing operations attributable
to CVS Caremark $ 0.51 $ 0.61 $ 0.72 $ 0.75 $ 2.59
Loss from discontinued operations attributable
to CVS Caremark – – (0.01) – (0.01)
Net income attributable to CVS Caremark $ 0.51 $ 0.61 $ 0.71 $ 0.75 $ 2.58
Diluted Earnings per common share:
Income from continuing operations attributable
to CVS Caremark $ 0.51 $ 0.60 $ 0.71 $ 0.74 $ 2.56
Loss from discontinued operations attributable
to CVS Caremark (0.01) – – – (0.01)
Net income attributable to CVS Caremark $ 0.50 $ 0.60 $ 0.71 $ 0.74 $ 2.55
Dividends per common share $ 0.07625 $ 0.07625 $ 0.07625 $ 0.07625 $ 0.30500
Stock price: (New York Stock Exchange)
High $ 30.47 $ 34.22 $ 37.75 $ 38.27 $ 38.27
Low $ 23.74 $ 27.08 $ 30.58 $ 27.38 $ 23.74
– 73 –