CVS 2010 Annual Report Download - page 51
Download and view the complete annual report
Please find page 51 of the 2010 CVS annual report below. You can navigate through the pages in the report by either clicking on the pages listed below, or by using the keyword search tool below to find specific information within the annual report.-
 1
1 -
2
-
3
-
4
-
5
-
6
-
7
-
8
-
9
-
10
-
11
-
12
-
13
-
14
-
15
-
16
-
17
-
18
-
19
-
20
-
21
-
22
-
23
-
24
-
25
-
26
-
27
-
28
-
29
-
30
-
31
-
32
-
33
-
34
-
35
-
36
-
37
-
38
-
39
-
40
-
 41
41 -
 42
42 -
 43
43 -
 44
44 -
 45
45 -
 46
46 -
 47
47 -
 48
48 -
 49
49 -
 50
50 -
 51
51 -
 52
52 -
 53
53 -
 54
54 -
 55
55 -
 56
56 -
 57
57 -
 58
58 -
 59
59 -
 60
60 -
 61
61 -
62
-
63
-
64
-
65
-
66
-
67
-
68
-
69
-
70
-
71
-
72
-
73
-
74
-
75
-
76
-
77
-
78
-
79
-
80
-
81
-
82
 |
 |

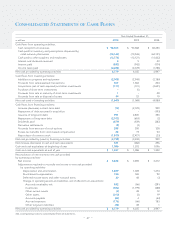
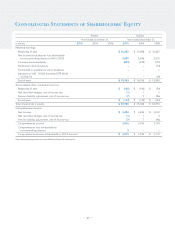
Consolidated Statements of Cash Flows
Year Ended December 31,
in millions 2010 2009 2008
Cash flows from operating activities:
Cash receipts from revenues $ 94,503 $ 93,568 $ 82,250
Cash paid for inventory and prescriptions dispensed by
retail network pharmacies (73,143) (73,536) (64,131)
Cash paid to other suppliers and employees (13,778) (13,121) (11,832)
Interest and dividends received 4 5 20
Interest paid (583) (542) (574)
Income taxes paid (2,224) (2,339) (1,786)
Net cash provided by operating activities 4,779 4,035 3,947
Cash flows from investing activities:
Additions to property and equipment (2,005) (2,548) (2,180)
Proceeds from sale-leaseback transactions 507 1,562 204
Acquisitions (net of cash acquired) and other investments (177) (101) (2,651)
Purchase of short-term investments – (5) –
Proceeds from sale or maturity of short-term investments 1 – 28
Proceeds from sale or disposal of assets 34 23 19
Net cash used in investing activities (1,640) (1,069) (4,580)
Cash flows from financing activities:
Increase (decrease) in short-term debt (15) (2,729) 959
Repayment of debt assumed in acquisition – – (353)
Issuance of long-term debt 991 2,800 350
Repayments of long-term debt (2,103) (653) (2)
Dividends paid (479) (439) (383)
Derivative settlements (5) (3) –
Proceeds from exercise of stock options 285 250 328
Excess tax benefits from stock-based compensation 28 19 53
Repurchase of common stock (1,500) (2,477) (23)
Net cash provided by (used in) financing activities (2,798) (3,232) 929
Net increase (decrease) in cash and cash equivalents 341 (266) 296
Cash and cash equivalents at beginning of year 1,086 1,352 1,056
Cash and cash equivalents at end of year $ 1,427 $ 1,086 $ 1,352
Reconciliation of net income to net cash provided
by operating activities:
Net income $ 3,424 $ 3,696 $ 3,212
Adjustments required to reconcile net income to net cash provided
by operating activities:
Depreciation and amortization 1,469 1,389 1,274
Stock-based compensation 150 165 92
Deferred income taxes and other noncash items 30 48 (3)
Change in operating assets and liabilities, net of effects from acquisitions:
Accounts receivable, net 532 (86) (291)
Inventories (352) (1,199) (488)
Other current assets (4) 48 12
Other assets (210) (2) 19
Accounts payable (40) 4 (64)
Accrued expenses (176) (66) 183
Other long-term liabilities (44) 38 1
Net cash provided by operating activities $ 4,779 $ 4,035 $ 3,947
See accompanying notes to consolidated financial statements.
– 47 –