CVS 2010 Annual Report Download - page 55
Download and view the complete annual report
Please find page 55 of the 2010 CVS annual report below. You can navigate through the pages in the report by either clicking on the pages listed below, or by using the keyword search tool below to find specific information within the annual report.-
 1
1 -
2
-
3
-
4
-
5
-
6
-
7
-
8
-
9
-
10
-
11
-
12
-
13
-
14
-
15
-
16
-
17
-
18
-
19
-
20
-
21
-
22
-
23
-
24
-
25
-
26
-
27
-
28
-
29
-
30
-
31
-
32
-
33
-
34
-
35
-
36
-
37
-
38
-
39
-
40
-
41
-
42
-
43
-
44
-
 45
45 -
 46
46 -
 47
47 -
 48
48 -
 49
49 -
 50
50 -
 51
51 -
 52
52 -
 53
53 -
 54
54 -
 55
55 -
 56
56 -
 57
57 -
 58
58 -
 59
59 -
 60
60 -
 61
61 -
 62
62 -
 63
63 -
 64
64 -
 65
65 -
66
-
67
-
68
-
69
-
70
-
71
-
72
-
73
-
74
-
75
-
76
-
77
-
78
-
79
-
80
-
81
-
82
 |
 |

Reclassifications – Certain reclassifications have been made to the 2009 and 2008 consolidated financial statements to conform
to the current year presentation.
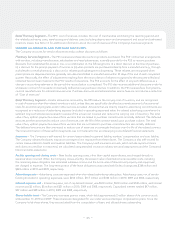
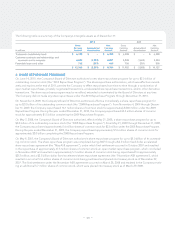
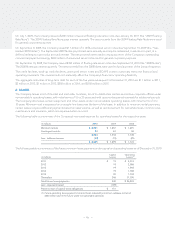
Fiscal Year Change – On December 23, 2008, the Board of Directors of the Company approved a change in the Company’s
fiscal year end from the Saturday nearest December 31 of each year to December 31 of each year to better reflect the Company’s
position in the health care, rather than the retail, industry. The fiscal year change was effective beginning with the fourth quarter
of fiscal 2008.
Following is a summary of the impact of the fiscal year change:
Fiscal Year Fiscal Year-End Fiscal Period Fiscal Period Includes
2010 December 31, 2010 January 1, 2010 - December 31, 2010 365 days
2009 December 31, 2009 January 1, 2009 - December 31, 2009 365 days
2008 December 31, 2008 December 30, 2007 - December 31, 2008 368 days
Unless otherwise noted, all references to years relate to the above fiscal years.
Use of estimates – The preparation of financial statements in conformity with accounting principles generally accepted in
the United States of America requires management to make estimates and assumptions that affect the reported amounts in
the consolidated financial statements and accompanying notes. Actual results could differ from those estimates.
Fair Value Hierarchy – The Company utilizes the three-level valuation hierarchy for the recognition and disclosure of fair value
measurements. The categorization of assets and liabilities within this hierarchy is based upon the lowest level of input that is
significant to the measurement of fair value. The three levels of the hierarchy consist of the following:
• Level 1 – Inputs to the valuation methodology are unadjusted quoted prices in active markets for identical assets or liabilities
that the Company has the ability to access at the measurement date.
• Level 2 – Inputs to the valuation methodology are quoted prices for similar assets and liabilities in active markets, quoted
prices in markets that are not active or inputs that are observable for the asset or liability, either directly or indirectly, for
substantially the full term of the instrument.
• Level 3 – Inputs to the valuation methodology are unobservable inputs based upon management’s best estimate of inputs
market participants could use in pricing the asset or liability at the measurement date, including assumptions about risk.
Cash and cash equivalents – Cash and cash equivalents consist of cash and temporary investments with maturities of three
months or less when purchased. The Company invests in short-term money market funds, commercial paper, time deposits,
as well as other debt securities that are classified as cash and cash equivalents within the accompanying consolidated balance
sheets, as these funds are highly liquid and readily convertible to known amounts of cash. These investments are classified
within Level 1 of the fair value hierarchy because they are valued using quoted market prices.
Short-term investments – The Company’s short-term investments consist of certificate of deposits with initial maturities
of greater than three months when purchased. These investments, which were classified as available-for-sale within Level 1
of the fair value hierarchy, were carried at historical cost, which approximated fair value at December 31, 2010 and 2009.
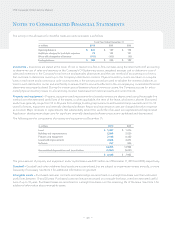
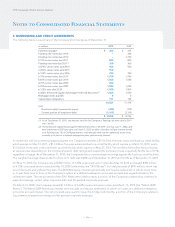
Fair value of financial instruments – As of December 31, 2010, the Company’s financial instruments include cash and cash
equivalents, accounts receivable, accounts payable and short-term debt. Due to the short-term nature of these instruments,
the Company’s carrying value approximates fair value. The carrying amount and estimated fair value of long-term debt was
$9.8 billion and $10.5 billion, respectively, as of December 31, 2010. The fair value of long-term debt was estimated based on
rates currently offered to the Company for debt with similar terms and maturities. The Company had outstanding letters of
credit, which guaranteed foreign trade purchases, with a fair value of $6 million and $9 million as of December 31, 2010 and 2009,
respectively. There were no outstanding investments in derivative financial instruments as of December 31, 2010 and 2009.
Accounts receivable – Accounts receivable are stated net of an allowance for doubtful accounts. The accounts receivable
balance primarily includes trade amounts due from third party providers (e.g., pharmacy benefit managers, insurance companies
and governmental agencies), clients and members, as well as vendors and manufacturers.
– 51 –