CVS 2010 Annual Report Download - page 60
Download and view the complete annual report
Please find page 60 of the 2010 CVS annual report below. You can navigate through the pages in the report by either clicking on the pages listed below, or by using the keyword search tool below to find specific information within the annual report.-
 1
1 -
2
-
3
-
4
-
5
-
6
-
7
-
8
-
9
-
10
-
11
-
12
-
13
-
14
-
15
-
16
-
17
-
18
-
19
-
20
-
21
-
22
-
23
-
24
-
25
-
26
-
27
-
28
-
29
-
30
-
31
-
32
-
33
-
34
-
35
-
36
-
37
-
38
-
39
-
40
-
41
-
42
-
43
-
44
-
45
-
46
-
47
-
48
-
49
-
 50
50 -
 51
51 -
 52
52 -
 53
53 -
 54
54 -
 55
55 -
 56
56 -
 57
57 -
 58
58 -
 59
59 -
 60
60 -
 61
61 -
 62
62 -
 63
63 -
 64
64 -
 65
65 -
 66
66 -
 67
67 -
 68
68 -
 69
69 -
 70
70 -
71
-
72
-
73
-
74
-
75
-
76
-
77
-
78
-
79
-
80
-
81
-
82
 |
 |

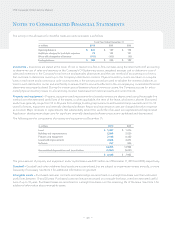
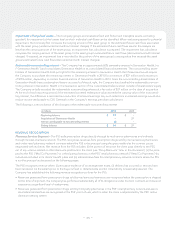
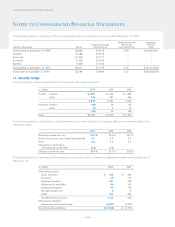
Notes to Consolidated Financial Statements
Accumulated other comprehensive loss – Accumulated other comprehensive loss consists of changes in the net actuarial gains
and losses associated with pension and other postretirement benefit plans, and unrealized losses on derivatives. The amount
included in accumulated other comprehensive loss related to the Company’s pension and postretirement plans was $217 million
pre-tax ($132 million after-tax) as of December 31, 2010 and $203 million pre-tax ($125 million after-tax) as of December 31, 2009.
The net impact on cash flow hedges totaled $18 million pre-tax ($11 million after-tax) and $15 million pre-tax ($10 million
after-tax) as of December 31, 2010 and 2009, respectively.
Stock-based compensation – Stock-based compensation expense is measured at the grant date based on the fair value of the
award and is recognized as expense over the applicable requisite service period of the stock award (generally 3 to 5 years) using
the straight-line method. Stock-based compensation costs are included in selling, general and administrative expenses.
Income taxes – The Company provides for federal and state income taxes currently payable, as well as for those deferred
because of timing differences between reported income and expenses for financial statement purposes versus tax purposes.
Federal and state tax credits are recorded as a reduction of income taxes. Deferred tax assets and liabilities are recognized
for the future tax consequences attributable to differences between the carrying amount of assets and liabilities for financial
reporting purposes and the amounts used for income tax purposes. Deferred tax assets and liabilities are measured using the
enacted tax rates expected to apply to taxable income in the years in which those temporary differences are expected to be
recoverable or settled. The effect of a change in tax rates is recognized as income or expense in the period of the change.
Loss from discontinued operations – In connection with certain business dispositions completed between 1991 and 1997,
the Company continues to guarantee store lease obligations for a number of former subsidiaries, including Linens ‘n Things.
On May 2, 2008, Linens Holding Co. and certain affiliates, which operate Linens ‘n Things, filed voluntary petitions under
Chapter 11 of the United States Bankruptcy Code in the United States Bankruptcy Court for the District of Delaware. The Com-
pany’s loss from discontinued operations includes lease related costs of $15 million ($24 million, net of a $9 million income tax
benefit), $12 million ($19 million, net of a $7 million income tax benefit) and $132 million ($214 million, net of an $82 million
income tax benefit) for the years ended December 31, 2010, 2009 and 2008, respectively, associated with the Linens ‘n Things
lease guarantees.
Earnings per common share – Basic earnings per common share is computed by dividing: (i) net earnings, after deducting
the after-tax Employee Stock Ownership Plan (“ESOP”) preference dividends, by (ii) the weighted average number of common
shares outstanding during the year (the “Basic Shares”).
When computing diluted earnings per common share for fiscal year 2008, the Company assumed that the ESOP preference
stock was converted into common stock and all dilutive stock awards were exercised. After the assumed ESOP preference stock
conversion, the ESOP Trust would hold common stock rather than ESOP preference stock and would receive common stock
dividends ($0.25800 per share in 2008) rather than ESOP preference stock dividends ($3.90 per share). Since the ESOP Trust used
the dividends it received to service its debt, the Company had to increase its contribution to the ESOP Trust to compensate it for
the lower dividends. This additional contribution reduced the Company’s net earnings, which in turn, reduced the amounts that
would be accrued under the Company’s incentive compensation plans.
Diluted earnings per common share is computed by dividing: (i) net income attributable to CVS Caremark, after accounting
for the difference between the dividends on the ESOP preference stock and common stock and after making adjustments for
the incentive compensation plans, by (ii) Basic Shares plus the additional shares that would be issued assuming that all dilutive
stock awards are exercised and the ESOP preference stock is converted into common stock. Options to purchase 34.3 million,
37.7 million and 20.9 million shares of common stock were outstanding as of December 31, 2010, 2009 and 2008, respectively,
but were not included in the calculation of diluted earnings per share because the options’ exercise prices were greater than
the average market price of the common shares and, therefore, the effect would be antidilutive. See Note 8 for additional
information about the ESOP.
– 56 –
CVS Caremark 2010 Annual Report