CVS 2010 Annual Report Download - page 34
Download and view the complete annual report
Please find page 34 of the 2010 CVS annual report below. You can navigate through the pages in the report by either clicking on the pages listed below, or by using the keyword search tool below to find specific information within the annual report.-
 1
1 -
2
-
3
-
4
-
5
-
6
-
7
-
8
-
9
-
10
-
11
-
12
-
13
-
14
-
15
-
16
-
17
-
18
-
19
-
20
-
21
-
22
-
23
-
 24
24 -
 25
25 -
 26
26 -
 27
27 -
 28
28 -
 29
29 -
 30
30 -
 31
31 -
 32
32 -
 33
33 -
 34
34 -
 35
35 -
 36
36 -
 37
37 -
 38
38 -
 39
39 -
 40
40 -
 41
41 -
 42
42 -
 43
43 -
 44
44 -
45
-
46
-
47
-
48
-
49
-
50
-
51
-
52
-
53
-
54
-
55
-
56
-
57
-
58
-
59
-
60
-
61
-
62
-
63
-
64
-
65
-
66
-
67
-
68
-
69
-
70
-
71
-
72
-
73
-
74
-
75
-
76
-
77
-
78
-
79
-
80
-
81
-
82
 |
 |

Management’s Discussion and Analysis of
Financial Condition and Results of Operations
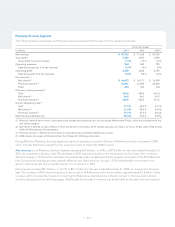
• Pharmacy revenue dollars continue to be negatively impacted in all years by the conversion of brand named drugs to
equivalent generic drugs, which typically have a lower selling price. In addition, our pharmacy growth has also been affected
by a decline in the number of significant new brand named drug introductions, higher consumer co-payments and co-insurance
arrangements, and an increase in the number of over-the-counter remedies that were historically only available by prescription.
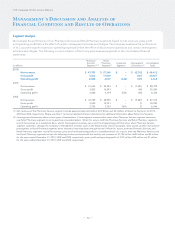
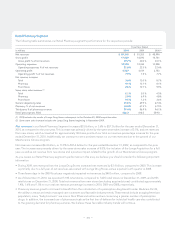
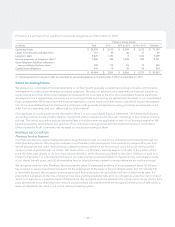
Gross profit in our Retail Pharmacy Segment includes net revenues less the cost of merchandise sold during the reporting
period and the related purchasing costs, warehousing costs, delivery costs and actual and estimated inventory losses.
Gross profit increased $446 million, or 2.7%, to $17.0 billion for the year ended December 31, 2010, as compared to the prior
year. Gross profit as a percentage of net revenues decreased to 29.7% for the year ended December 31, 2010, compared to
30.0% for the prior year. The decline in gross profit as a percentage of net revenues was driven by declines in the gross profit
of our pharmacy sales, partially offset by increases in the gross profit of our front store sales.
Gross profit increased $1.9 billion, or 12.6%, to $16.6 billion for the year ended December 31, 2009, as compared to the prior
year. Gross profit as a percentage of net revenues decreased to 30.0% for the year ended December 31, 2009, compared to
30.1% for the prior year.
As you review our Retail Pharmacy segment’s performance in this area, we believe you should consider the following important
information:
• Three fewer days in the 2009 fiscal year negatively impacted gross profit by $123 million, compared to 2008.
• On average, our gross profit on front-store revenues is higher than our average gross profit on pharmacy revenues. During
2010, our front-store revenues were 32.0% of total revenues, compared to 32.5% in both 2009 and 2008. During 2010, our
pharmacy revenues were 68.0% of total revenues, compared to 67.5% in both 2009 and 2008. This shift in sales mix had a
negative effect on our overall gross profit for the year ended December 31, 2010.
• During 2010, our front-store gross profit rate was positively impacted by increases in private label and proprietary brand product
sales, which normally yield a higher gross profit rate than other front-store products. During 2009, our front-store gross profit
rate was negatively impacted by increased sales of promotional related items, which were partially offset by increases in
private label and proprietary brand product sales.
• During 2010, 2009 and 2008, our pharmacy gross profit rate continued to benefit from an increase in generic drug revenues,
which normally yield a higher gross profit rate than equivalent brand name drug revenues.
• Our pharmacy gross profit rates have been adversely affected by the efforts of managed care organizations, pharmacy benefit
managers and governmental and other third-party payors to reduce their prescription drug costs. In the event this trend contin-
ues, we may not be able to sustain our current rate of revenue growth and gross profit dollars could be adversely impacted.
• The increased use of generic drugs has augmented the efforts of third party payors to reduce reimbursement payments to
retail pharmacies for prescriptions. This trend, which we expect to continue, reduces the benefit we realize from brand to
generic product conversions.
• Sales to customers covered by third party insurance programs have continued to increase and, thus, have become a larger
component of our total pharmacy business. On average, our gross profit on third party pharmacy revenues is lower than our
gross profit on cash pharmacy revenues. Third party pharmacy revenues were 97.4% of pharmacy revenues in 2010, compared
to 96.9% and 96.1% of pharmacy revenues in 2009 and 2008, respectively. We expect this trend to continue.
• The Federal Government’s Medicare Part D benefit is increasing prescription utilization. However, it is also decreasing our
pharmacy gross profit rates as our higher gross profit business (e.g., cash customers) continued to migrate to Part D coverage
during 2010 and 2009.
• The Patient Protection and Affordable Care Act and the Health Care and Education Reconciliation Act (collectively, “PPACA”)
made several significant changes to Medicaid rebates and reimbursement. One of these changes was to revise the definition
of Average Manufacturer Price and the reimbursement formula for multi-source drugs. CMS has not yet issued regulations
implementing these changes. Therefore, we cannot predict the effect these changes will have on Medicaid reimbursement
or their impact on the Company.
– 30 –
CVS Caremark 2010 Annual Report