CVS 2010 Annual Report Download - page 70
Download and view the complete annual report
Please find page 70 of the 2010 CVS annual report below. You can navigate through the pages in the report by either clicking on the pages listed below, or by using the keyword search tool below to find specific information within the annual report.-
 1
1 -
2
-
3
-
4
-
5
-
6
-
7
-
8
-
9
-
10
-
11
-
12
-
13
-
14
-
15
-
16
-
17
-
18
-
19
-
20
-
21
-
22
-
23
-
24
-
25
-
26
-
27
-
28
-
29
-
30
-
31
-
32
-
33
-
34
-
35
-
36
-
37
-
38
-
39
-
40
-
41
-
42
-
43
-
44
-
45
-
46
-
47
-
48
-
49
-
50
-
51
-
52
-
53
-
54
-
55
-
56
-
57
-
58
-
59
-
 60
60 -
 61
61 -
 62
62 -
 63
63 -
 64
64 -
 65
65 -
 66
66 -
 67
67 -
 68
68 -
 69
69 -
 70
70 -
 71
71 -
 72
72 -
 73
73 -
 74
74 -
 75
75 -
 76
76 -
 77
77 -
 78
78 -
 79
79 -
 80
80 -
81
-
82
 |
 |

Notes to Consolidated Financial Statements
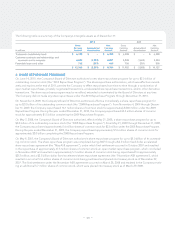
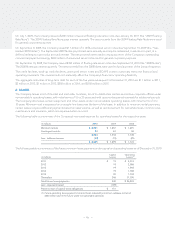
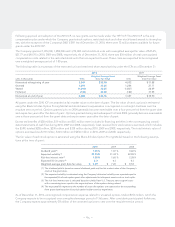
The following table is a summary of the Company’s stock option activity for the year ended December 31, 2010:
Weighted Average Aggregate
Weighted Average Remaining Intrinsic
shares in thousands Shares Exercise Price Contractual Term Value
Outstanding at December 31, 2009 66,269 $ 29.14 4.39 345,068,000
Granted 14,168 $ 35.16 – –
Exercised (10,463) $ 21.71 – –
Forfeited (2,332) $ 33.50 – –
Expired (1,625) $ 31.83 – –
Outstanding at December 31, 2010 66,017 $ 31.39 4.16 $ 313,163,000
Exercisable at December 31, 2010 36,789 $ 29.64 3.03 $ 235,843,000
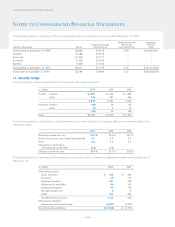
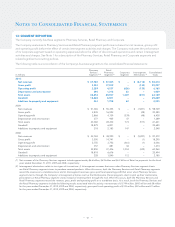
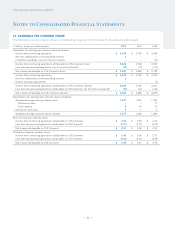
11: INCOME TAXES
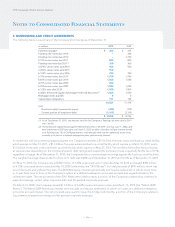
The income tax provision consisted of the following for the respective years:
in millions 2010 2009 2008
Current: Federal $ 1,894 $ 1,766 $ 1,680
State 345 397 365
2,239 2,163 2,045
Deferred: Federal (44) 38 133
State (5) 4 15
(49) 42 148
Total $ 2,190 $ 2,205 $ 2,193
The following table is a reconciliation of the statutory income tax rate to the Company’s effective income tax rate for the
respective years:
2010 2009 2008
Statutory income tax rate 35.0 % 35.0 % 35.0 %
State income taxes, net of federal tax benefit 4.1 4.5 4.1
Other 0.6 0.6 0.5
Recognition of previously
unrecognized tax benefits (0.8) (2.8) –
Effective income tax rate 38.9 % 37.3 % 39.6 %
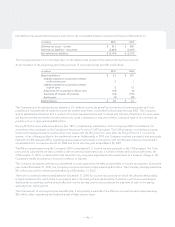
The following table is a summary of the significant components of the Company’s deferred tax assets and liabilities as of
December 31:
in millions 2010 2009
Deferred tax assets:
Lease and rents $ 325 $ 334
Inventory 69 55
Employee benefits 261 250
Allowance for bad debt 96 130
Retirement benefits 99 94
Net operating losses 6 8
Other 307 287
Total deferred tax assets 1,163 1,158
Deferred tax liabilities:
Depreciation and amortization (4,307) (4,330)
Net deferred tax liabilities $ (3,144) $ (3,172)
– 66 –
CVS Caremark 2010 Annual Report