CVS 2010 Annual Report Download - page 33
Download and view the complete annual report
Please find page 33 of the 2010 CVS annual report below. You can navigate through the pages in the report by either clicking on the pages listed below, or by using the keyword search tool below to find specific information within the annual report.-
 1
1 -
2
-
3
-
4
-
5
-
6
-
7
-
8
-
9
-
10
-
11
-
12
-
13
-
14
-
15
-
16
-
17
-
18
-
19
-
20
-
21
-
22
-
 23
23 -
 24
24 -
 25
25 -
 26
26 -
 27
27 -
 28
28 -
 29
29 -
 30
30 -
 31
31 -
 32
32 -
 33
33 -
 34
34 -
 35
35 -
 36
36 -
 37
37 -
 38
38 -
 39
39 -
 40
40 -
 41
41 -
 42
42 -
 43
43 -
44
-
45
-
46
-
47
-
48
-
49
-
50
-
51
-
52
-
53
-
54
-
55
-
56
-
57
-
58
-
59
-
60
-
61
-
62
-
63
-
64
-
65
-
66
-
67
-
68
-
69
-
70
-
71
-
72
-
73
-
74
-
75
-
76
-
77
-
78
-
79
-
80
-
81
-
82
 |
 |

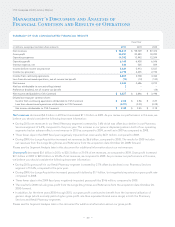
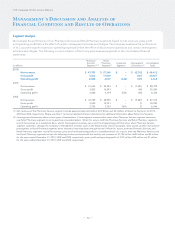
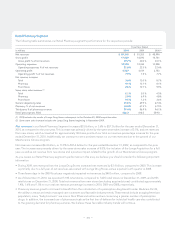
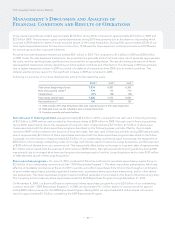
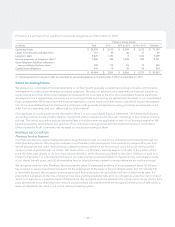
Retail Pharmacy Segment
The following table summarizes our Retail Pharmacy segment’s performance for the respective periods:
Fiscal Year Ended
in millions 2010 2009 2008 (1)
Net revenues $ 57,345 $ 55,355 $ 48,990
Gross profit 17,039 16,593 14,741
Gross profit % of net revenues 29.7 % 30.0 % 30.1 %
Operating expenses 12,502 12,434 10,988
Operating expenses % of net revenues 21.8 % 22.5 % 22.4 %
Operating profit 4,537 4,159 3,753
Operating profit % of net revenues 7.9 % 7.5 % 7.7 %
Net revenue increase:
Total 3.6 % 13.0 % 8.7 %
Pharmacy 4.1 % 13.1 % 8.1 %
Front Store 2.6 % 12.7 % 9.9 %
Same store sales increase: (2)
Total 2.1 % 5.0 % 4.5 %
Pharmacy 2.9 % 6.9 % 4.8 %
Front Store 0.5 % 1.2 % 3.6 %
Generic dispensing rates 73.0 % 69.9 % 67.4 %
Pharmacy % of net revenues 68.0 % 67.5 % 67.5 %
Third party % of pharmacy revenue 97.4 % 96.9 % 96.1 %
Retail prescriptions filled 636.3 616.5 559.0
(1) 2008 includes the results of Longs Drug Stores subsequent to the October 20, 2008 acquisition date.
(2) Same store sales increase includes the Longs Drug Stores beginning in November 2009.
Net revenues in our Retail Pharmacy Segment increased $2.0 billion, or 3.6% to $57.3 billion for the year ended December 31,
2010, as compared to the prior year. This increase was primarily driven by the same store sales increase of 2.1%, and net revenues
from new stores, which accounted for approximately 140 basis points of our total net revenue percentage increase for the year
ended December 31, 2010. Additionally, we continue to see a positive impact on our net revenues due to the growth of our
Maintenance Choice program.
Net revenues increased $6.4 billion, or 13.0% to $55.4 billion for the year ended December 31, 2009, as compared to the prior
year. The increase was primarily driven by the same store sales increase of 5.0%, the inclusion of the Longs Acquisition for a full
year, as well as net revenue from new stores and a positive impact related to the growth of our Maintenance Choice program.
As you review our Retail Pharmacy segment’s performance in this area, we believe you should consider the following important
information:
• During 2009, net revenues from the Longs Drug Stores increased net revenues by $3.4 billion, compared to 2008. This increase
is primarily due to a full year of net revenues associated with Longs Drug Stores versus a partial fourth quarter in 2008.
• Three fewer days in the 2009 fiscal year negatively impacted net revenues by $403 million, compared to 2008.
• As of December 31, 2010, we operated 7,182 retail stores, compared to 7,025 retail stores on December 31, 2009, and 6,923
retail stores on December 31, 2008. Total net revenues from new stores (excluding acquired stores) contributed approximately
1.4%, 1.6% and 1.5% to our total net revenue percentage increase in 2010, 2009 and 2008, respectively.
• Pharmacy revenue growth continued to benefit from the introduction of a prescription drug benefit under Medicare Part D,
the ability to attract and retain managed care customers and favorable industry trends. These trends include an aging American
population; many “baby boomers” are now in their fifties and sixties and are consuming a greater number of prescription
drugs. In addition, the increased use of pharmaceuticals as the first line of defense for individual health care also contributed
to the growing demand for pharmacy services. We believe these favorable industry trends will continue.
– 29 –