CVS 2010 Annual Report Download - page 30
Download and view the complete annual report
Please find page 30 of the 2010 CVS annual report below. You can navigate through the pages in the report by either clicking on the pages listed below, or by using the keyword search tool below to find specific information within the annual report.-
 1
1 -
2
-
3
-
4
-
5
-
6
-
7
-
8
-
9
-
10
-
11
-
12
-
13
-
14
-
15
-
16
-
17
-
18
-
19
-
 20
20 -
 21
21 -
 22
22 -
 23
23 -
 24
24 -
 25
25 -
 26
26 -
 27
27 -
 28
28 -
 29
29 -
 30
30 -
 31
31 -
 32
32 -
 33
33 -
 34
34 -
 35
35 -
 36
36 -
 37
37 -
 38
38 -
 39
39 -
 40
40 -
41
-
42
-
43
-
44
-
45
-
46
-
47
-
48
-
49
-
50
-
51
-
52
-
53
-
54
-
55
-
56
-
57
-
58
-
59
-
60
-
61
-
62
-
63
-
64
-
65
-
66
-
67
-
68
-
69
-
70
-
71
-
72
-
73
-
74
-
75
-
76
-
77
-
78
-
79
-
80
-
81
-
82
 |
 |

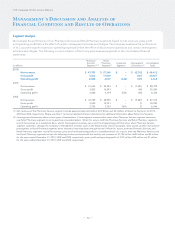
Management’s Discussion and Analysis of
Financial Condition and Results of Operations
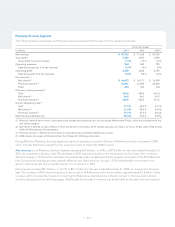
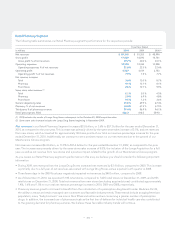
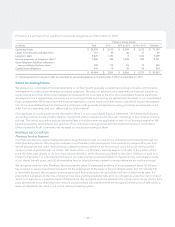
As you review our Pharmacy Services segment’s revenue performance, we believe you should consider the following important
information:
• The Pharmacy Services segment recognizes revenues for its pharmacy network transactions based on individual contract
terms. In accordance with ASC 605, Revenue Recognition (formerly Emerging Issues Task Force (“EITF”) EITF No. 99-19,
“Reporting Revenue Gross as a Principal vs Net as an Agent”), Caremark’s contracts are predominantly accounted for using
the gross method. Prior to April 1, 2009, RxAmerica’s contracts were accounted for using the net method. Effective April 1,
2009, we converted a number of RxAmerica’s retail pharmacy network contracts and a large health plan to the Caremark
contract structure, which resulted in those contracts being accounted for using the gross method. As a result, net revenues
increased by $1.1 billion during 2010 as compared to 2009, and by $2.5 billion during 2009 as compared to 2008.
• Three fewer days in the 2009 fiscal year negatively impacted net revenues by $268 million, compared to 2008.
• During 2010, our mail choice claims processed decreased 2.7% to 64.2 million claims. This decrease was primarily due to the
termination of a few large client contracts effective January 1, 2010, partially offset by new client starts on January 1, 2010.
During 2009, our mail choice claims processed increased 8.3% to 66.0 million claims. This increase was primarily due to
favorable net new business and the significant adoption of the mail choice plan design.
• During 2010 and 2009, our average revenue per mail choice claim increased by 2.6% and 3.5%, compared to 2009 and 2008,
respectively. This increase was primarily due to drug cost inflation and claims mix, partially offset by an increase in the percent-
age of generic prescription drugs dispensed and changes in client pricing.
• During 2010, our mail choice generic dispensing rate increased to 61.3%, compared to our mail choice generic dispensing
rate of 56.5% in 2009. During 2009, our mail choice generic dispensing rate increased to 56.5% compared to our mail choice
generic dispensing rate of 54.4% in 2008. This continued increase was primarily due to new generic prescription drug introduc-
tions and our continuous effort to encourage plan members to use generic prescription drugs when they are available.
• During 2010, our pharmacy network claims processed decreased 12.1% to 520.6 million compared to 592.5 million pharmacy
network claims processed in 2009. The decrease in 2010 was primarily due to the termination of a few large client contracts
effective January 1, 2010 and the decrease of covered lives under our Medicare Part D program as a result of the 2010 Medi-
care Part D competitive bidding process. During 2009, our pharmacy network claims processed increased 3.5% or 20.0 million
from 572.5 million in 2008. The increase in 2009 was primarily due to an increase in RxAmerica claims of 61.0 million compared
with 2008. The RxAmerica increase was partially offset by the reduction in claims due to the termination of two large health
plan clients effective January 1, 2009 and having three fewer days in 2009 compared to 2008.
• During 2010, our average revenue per pharmacy network claim processed increased by 2.7%, compared to 2009. The increase
was primarily due to the conversion of RxAmerica’s pharmacy network contracts from net to gross on April 1, 2009, (ii) a
change in the revenue recognition method from net to gross for a large health plan on March 1, 2009 and (iii) higher drug
costs, partially offset by an increase in our pharmacy network generic dispensing rate and changes in client pricing.
• During 2009, our average revenue per pharmacy network claim processed increased by 15.4%, compared to 2008. The
increase was primarily due to (i) the inclusion of RxAmerica results, whose retail pharmacy network contracts were accounted
for using the net revenue recognition method prior to April 1, 2009, as discussed previously; (ii) higher drug costs, which
normally result in higher claim revenues, and (iii) claims mix; partially offset by client pricing, and changes in the percentage of
generic drugs dispensed.
• During 2010, our pharmacy network generic dispensing rate increased to 72.7% compared to our pharmacy network generic
dispensing rate of 69.3% in 2009. During 2009, our pharmacy network generic dispensing rate increased to 69.3%, compared
to our pharmacy network generic dispensing rate of 66.2% in 2008. These continued increases were primarily due to the
impact of new generic drug introductions and our continuous efforts to encourage plan members to use generic drugs when
they are available. Additionally, the increase in 2009 as compared to 2008 was partially attributable to the full-year impact of
RxAmerica claims which increased our generic dispensing rate by approximately 120 basis points in 2009 compared to 2008.
We believe our generic dispensing rates will continue to increase in future periods. This increase will be affected by, among
other things, the number of new generic drug introductions and our success at encouraging plan members to utilize generic
drugs when they are available.
– 26 –
CVS Caremark 2010 Annual Report