CVS 2010 Annual Report Download - page 28
Download and view the complete annual report
Please find page 28 of the 2010 CVS annual report below. You can navigate through the pages in the report by either clicking on the pages listed below, or by using the keyword search tool below to find specific information within the annual report.-
 1
1 -
2
-
3
-
4
-
5
-
6
-
7
-
8
-
9
-
10
-
11
-
12
-
13
-
14
-
15
-
16
-
17
-
 18
18 -
 19
19 -
 20
20 -
 21
21 -
 22
22 -
 23
23 -
 24
24 -
 25
25 -
 26
26 -
 27
27 -
 28
28 -
 29
29 -
 30
30 -
 31
31 -
 32
32 -
 33
33 -
 34
34 -
 35
35 -
 36
36 -
 37
37 -
 38
38 -
39
-
40
-
41
-
42
-
43
-
44
-
45
-
46
-
47
-
48
-
49
-
50
-
51
-
52
-
53
-
54
-
55
-
56
-
57
-
58
-
59
-
60
-
61
-
62
-
63
-
64
-
65
-
66
-
67
-
68
-
69
-
70
-
71
-
72
-
73
-
74
-
75
-
76
-
77
-
78
-
79
-
80
-
81
-
82
 |
 |

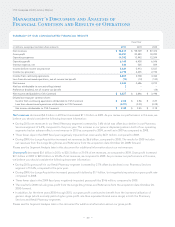
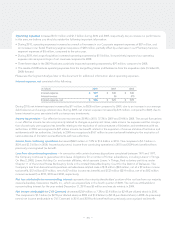
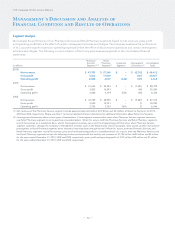
Management’s Discussion and Analysis of
Financial Condition and Results of Operations
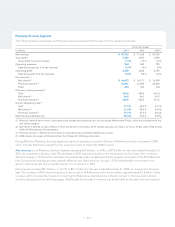
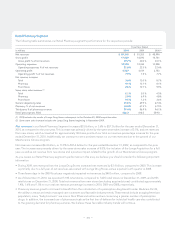
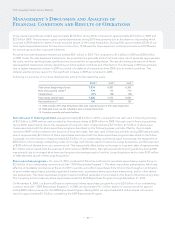
Segment Analysis
We evaluate the performance of our Pharmacy Services and Retail Pharmacy segments based on net revenues, gross profit
and operating profit before the effect of certain intersegment activities and charges. The Company evaluates the performance
of its Corporate segment based on operating expenses before the effect of discontinued operations and certain intersegment
activities and charges. The following is a reconciliation of the Company’s business segments to the consolidated financial
statements:
Pharmacy Retail
Services Pharmacy Corporate Intersegment Consolidated
in millions Segment (1) (2) Segment (2) Segment Eliminations (2) Totals
2010:
Net revenues $ 47,780 $ 57,345 $ – $ (8,712) $ 96,413
Gross profit 3,353 17,039 – (135) 20,257
Operating profit 2,389 4,537 (626) (135) 6,165
2009:
Net revenues $ 51,065 $ 55,355 $ – $ (7,691) $ 98,729
Gross profit 3,835 16,593 – (48) 20,380
Operating profit 2,866 4,159 (539) (48) 6,438
2008:
Net revenues $ 43,769 $ 48,990 $ – $ (5,287) $ 87,472
Gross profit 3,550 14,741 – (1) 18,290
Operating profit 2,755 3,753 (461) (1) 6,046
(1) Net revenues of the Pharmacy Services segment include approximately $6.6 billion, $6.9 billion and $6.3 billion of Retail Co-Payments for 2010,
2009 and 2008, respectively. Please see Note 1 to the consolidated financial statements for additional information about Retail Co-Payments.
(2) Intersegment eliminations relate to two types of transactions: (i) Intersegment revenues that occur when Pharmacy Services segment customers
use Retail Pharmacy segment stores to purchase covered products. When this occurs, both the Pharmacy Services and Retail Pharmacy segments
record the revenue on a standalone basis, and (ii) Intersegment revenues, gross profit and operating profit that occur when Pharmacy Services
segment customers, through the Company’s intersegment activities (such as the Maintenance Choice® program), elect to pick up their maintenance
prescriptions at Retail Pharmacy segment stores instead of receiving them through the mail. When this occurs, both the Pharmacy Services and
Retail Pharmacy segments record the revenue, gross profit and operating profit on a standalone basis. As a result, both the Pharmacy Services and
the Retail Pharmacy segments include the following results associated with this activity: net revenues of $1,794 million, $692 million and $8 million
for the years ended December 31, 2010, 2009 and 2008, respectively; gross profit and operating profit of $135 million, $48 million and $1 million
for the years ended December 31, 2010, 2009 and 2008, respectively.
– 24 –
CVS Caremark 2010 Annual Report