CVS 2010 Annual Report Download - page 36
Download and view the complete annual report
Please find page 36 of the 2010 CVS annual report below. You can navigate through the pages in the report by either clicking on the pages listed below, or by using the keyword search tool below to find specific information within the annual report.-
 1
1 -
2
-
3
-
4
-
5
-
6
-
7
-
8
-
9
-
10
-
11
-
12
-
13
-
14
-
15
-
16
-
17
-
18
-
19
-
20
-
21
-
22
-
23
-
24
-
25
-
 26
26 -
 27
27 -
 28
28 -
 29
29 -
 30
30 -
 31
31 -
 32
32 -
 33
33 -
 34
34 -
 35
35 -
 36
36 -
 37
37 -
 38
38 -
 39
39 -
 40
40 -
 41
41 -
 42
42 -
 43
43 -
 44
44 -
 45
45 -
 46
46 -
47
-
48
-
49
-
50
-
51
-
52
-
53
-
54
-
55
-
56
-
57
-
58
-
59
-
60
-
61
-
62
-
63
-
64
-
65
-
66
-
67
-
68
-
69
-
70
-
71
-
72
-
73
-
74
-
75
-
76
-
77
-
78
-
79
-
80
-
81
-
82
 |
 |

Management’s Discussion and Analysis of
Financial Condition and Results of Operations
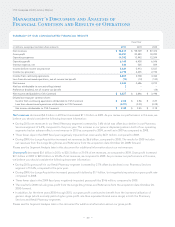
Gross capital expenditures totaled approximately $2.0 billion during 2010, compared to approximately $2.5 billion in 2009 and
$2.2 billion 2008. The decrease in gross capital expenditures during 2010 was primarily due to the absence of spending which
occurred in 2009 related to resets of stores acquired as part of the Longs Acquisition. During 2010, approximately 52.0% of our
total capital expenditures were for new store construction, 14.5% were for store expansion and improvements and 33.5% were
for technology and other corporate initiatives.
Proceeds from sale-leaseback transactions totaled $507 million in 2010. This compares to $1.6 billion in 2009 and $204 million
in 2008. Under the sale-leaseback transactions, the properties are generally sold at net book value, which generally approximates
fair value, and the resulting leases qualify and are accounted for as operating leases. The specific timing and amount of future
sale-leaseback transactions will vary depending on future market conditions and other factors. The decrease in 2010 was primarily
due to higher transaction volume in 2009 as a result of a deferral of transactions from 2008, due to market conditions. This
deferral was the primary reason for the significant increase in 2009 as compared to 2008.
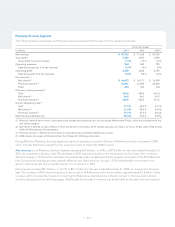
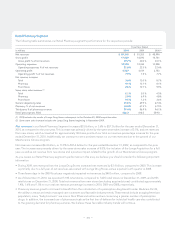
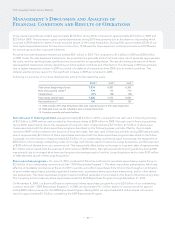
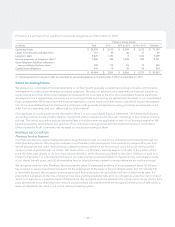
Following is a summary of our store development activity for the respective years:
2010 (3) 2009 (3) 2008 (3)
Total stores (beginning of year) 7,074 6,981 6,301
New and acquired stores (1) 179 175 719
Closed stores (27) (82) (39)
Total stores (end of year) 7,226 7,074 6,981
Relocated stores (2) 106 110 129
(1) 2008 includes 529 Longs Drug Stores that were acquired as part of the Longs Acquisition.
(2) Relocated stores are not included in new or closed store totals.
(3) Excludes specialty mail order facilities.
Net cash used in financing activities was approximately $2.8 billion in 2010, compared to net cash used in financing activities
of $3.2 billion in 2009 and net cash provided by financing activities of $929 million in 2008. Net cash used in financing activities
during 2010, was primarily due to the repayment of long term debt, of approximately $2.1 billion, $1.5 billion of share repur-
chases associated with the share repurchase programs described on the following pages, partially offset by the proceeds
received of $991 million related to the issuance of long-term debt. Net cash used in financing activities during 2009 was primarily
due to approximately $2.5 billion of share repurchases associated with the share repurchase programs described on the follow-
ing pages, the net reduction of approximately $2.2 billion of our outstanding commercial paper borrowings, the repayment of
$500 million of borrowings outstanding under our bridge credit facility used to finance the Longs Acquisition, and the payment
of $439 million of dividends on our common stock. This was partially offset by the net increase in long-term debt of approximately
$2.1 billion and proceeds from the exercise of stock options of $250 million. Net cash provided by financing activities during 2008
was primarily due to increased short-term and long-term borrowings used to fund the Longs Acquisition and to retire $353 million
of debt assumed as part of the Longs Acquisition.
Share repurchase programs – On June 14, 2010, our Board of Directors authorized a new share repurchase program for up to
$2.0 billion of our outstanding common stock (the “2010 Repurchase Program”). The share repurchase authorization, which was
effective immediately and expires at the end of 2011, permits us to effect repurchases from time to time through a combination
of open market repurchases, privately negotiated transactions, accelerated share repurchase transactions, and/or other deriva-
tive transactions. The share repurchase program may be modified, extended or terminated by the Board of Directors at any time.
The Company did not make any share repurchases under the 2010 Repurchase Program through December 31, 2010.
On November 4, 2009, our Board of Directors authorized a share repurchase program for up to $2.0 billion of our outstanding
common stock (the “2009 Repurchase Program”). In 2009, we repurchased 16.1 million shares of common stock for approxi-
mately $500 million pursuant to the 2009 Repurchase Program. During 2010, we repurchased 42.4 million shares of common
stock for approximately $1.5 billion, completing the 2009 Repurchase Program.
– 32 –
CVS Caremark 2010 Annual Report