CVS 2010 Annual Report Download - page 29
Download and view the complete annual report
Please find page 29 of the 2010 CVS annual report below. You can navigate through the pages in the report by either clicking on the pages listed below, or by using the keyword search tool below to find specific information within the annual report.-
 1
1 -
2
-
3
-
4
-
5
-
6
-
7
-
8
-
9
-
10
-
11
-
12
-
13
-
14
-
15
-
16
-
17
-
18
-
 19
19 -
 20
20 -
 21
21 -
 22
22 -
 23
23 -
 24
24 -
 25
25 -
 26
26 -
 27
27 -
 28
28 -
 29
29 -
 30
30 -
 31
31 -
 32
32 -
 33
33 -
 34
34 -
 35
35 -
 36
36 -
 37
37 -
 38
38 -
 39
39 -
40
-
41
-
42
-
43
-
44
-
45
-
46
-
47
-
48
-
49
-
50
-
51
-
52
-
53
-
54
-
55
-
56
-
57
-
58
-
59
-
60
-
61
-
62
-
63
-
64
-
65
-
66
-
67
-
68
-
69
-
70
-
71
-
72
-
73
-
74
-
75
-
76
-
77
-
78
-
79
-
80
-
81
-
82
 |
 |

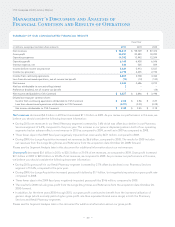
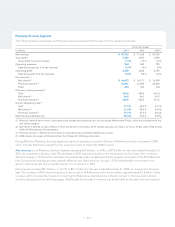
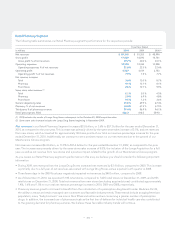
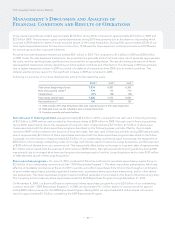
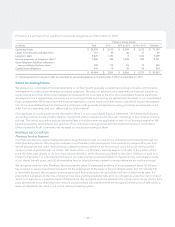
Pharmacy Services Segment
The following table summarizes our Pharmacy Services segment’s performance for the respective periods:
Fiscal Year Ended
in millions 2010 2009 2008(4)
Net revenues $ 47,780 $ 51,065 $ 43,769
Gross profit 3,353 3,835 3,550
Gross profit % of net revenues 7.0 % 7.5 % 8.1 %
Operating expenses 964 969 795
Operating expenses % of net revenues 2.0 % 1.9 % 1.8 %
Operating profit 2,389 2,866 2,755
Operating profit % of net revenues 5.0 % 5.6 % 6.3 %
Net revenues (1):
Mail choice (2) $ 16,675 $ 16,711 $ 14,909
Pharmacy network (3) 30,681 34,004 28,482
Other 424 350 378
Pharmacy claims processed (1)
Total 584.8 658.5 633.4
Mail choice (2) 64.2 66.0 60.9
Pharmacy network (3) 520.6 592.5 572.5
Generic dispensing rate (1):
Total 71.5 % 68.2 % 65.1 %
Mail choice (2) 61.3 % 56.5 % 54.4 %
Pharmacy network (3) 72.7 % 69.3 % 66.2 %
Mail choice penetration rate 25.8 % 23.8 % 22.9 %
(1) Pharmacy network net revenues, claims processed and generic dispensing rates do not include Maintenance Choice, which are included within the
mail choice category.
(2) Mail choice is defined as claims filled at a Pharmacy Services’ mail facility, which includes specialty mail claims, as well as 90-day claims filled at retail
under the Maintenance Choice program.
(3) Pharmacy network is defined as claims filled at retail pharmacies, including CVS/pharmacy stores.
(4) 2008 includes the results of RxAmerica from the October 20, 2008 acquisition date.
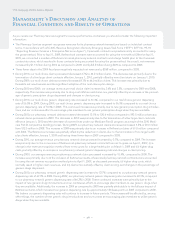
During 2009, the Pharmacy Services segment’s results of operations include a full year of RxAmerica results compared to 2008,
which includes RxAmerica results from the acquisition date (October 20, 2008) forward.
Net revenues in our Pharmacy Services Segment decreased $3.3 billion, or 6.4%, to $47.8 billion for the year ended December 31,
2010, as compared to the prior year. The decrease in 2010 was primarily due to the termination of a few large client contracts
effective January 1, 2010 and the decrease of covered lives under our Medicare Part D program as a result of the 2010 Medicare
Part D competitive bidding process, partially offset by new client starts on January 1, 2010. Additionally, the increase in our
generic dispensing rate had a negative impact on our revenue in 2010.
Net revenues increased $7.3 billion, or 16.7%, to $51.1 billion for the year ended December 31, 2009, as compared to the prior
year. The increase in 2009 was primarily due to the inclusion of RxAmerica which accounted for approximately $3.2 billion of the
increase, which included the impact of converting the RxAmerica retail pharmacy network contract to the Caremark contract
structure discussed on the following pages. Additionally the increase in revenue was attributable to favorable net new business.
– 25 –